What Kind Of Shareholders Own OSB Group Plc (LON:OSB)?
A look at the shareholders of OSB Group Plc (LON:OSB) can tell us which group is most powerful. Insiders often own a large chunk of younger, smaller, companies while huge companies tend to have institutions as shareholders. Companies that have been privatized tend to have low insider ownership.
OSB Group has a market capitalization of UK£1.9b, so we would expect some institutional investors to have noticed the stock. Taking a look at our data on the ownership groups (below), it seems that institutions own shares in the company. Let's delve deeper into each type of owner, to discover more about OSB Group.
View our latest analysis for OSB Group

What Does The Institutional Ownership Tell Us About OSB Group?
Many institutions measure their performance against an index that approximates the local market. So they usually pay more attention to companies that are included in major indices.
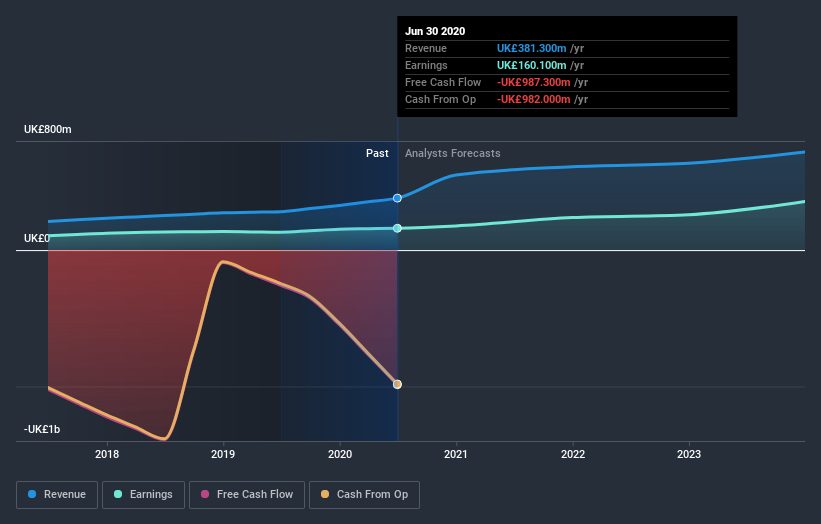
OSB Group already has institutions on the share registry. Indeed, they own a respectable stake in the company. This implies the analysts working for those institutions have looked at the stock and they like it. But just like anyone else, they could be wrong. If multiple institutions change their view on a stock at the same time, you could see the share price drop fast. It's therefore worth looking at OSB Group's earnings history below. Of course, the future is what really matters.
Investors should note that institutions actually own more than half the company, so they can collectively wield significant power. It would appear that 6.9% of OSB Group shares are controlled by hedge funds. That's interesting, because hedge funds can be quite active and activist. Many look for medium term catalysts that will drive the share price higher. Our data shows that Elliott Management Corporation is the largest shareholder with 6.9% of shares outstanding. In comparison, the second and third largest shareholders hold about 6.6% and 5.8% of the stock.
Looking at the shareholder registry, we can see that 50% of the ownership is controlled by the top 16 shareholders, meaning that no single shareholder has a majority interest in the ownership.
While it makes sense to study institutional ownership data for a company, it also makes sense to study analyst sentiments to know which way the wind is blowing. Quite a few analysts cover the stock, so you could look into forecast growth quite easily.
Insider Ownership Of OSB Group
The definition of company insiders can be subjective and does vary between jurisdictions. Our data reflects individual insiders, capturing board members at the very least. Company management run the business, but the CEO will answer to the board, even if he or she is a member of it.
Most consider insider ownership a positive because it can indicate the board is well aligned with other shareholders. However, on some occasions too much power is concentrated within this group.
Our data suggests that insiders own under 1% of OSB Group Plc in their own names. It is a pretty big company, so it would be possible for board members to own a meaningful interest in the company, without owning much of a proportional interest. In this case, they own around UK£13m worth of shares (at current prices). It is always good to see at least some insider ownership, but it might be worth checking if those insiders have been selling.
General Public Ownership
The general public holds a 22% stake in OSB Group. This size of ownership, while considerable, may not be enough to change company policy if the decision is not in sync with other large shareholders.
Next Steps:
While it is well worth considering the different groups that own a company, there are other factors that are even more important. For example, we've discovered 2 warning signs for OSB Group (1 is significant!) that you should be aware of before investing here.
If you would prefer discover what analysts are predicting in terms of future growth, do not miss this free report on analyst forecasts.
NB: Figures in this article are calculated using data from the last twelve months, which refer to the 12-month period ending on the last date of the month the financial statement is dated. This may not be consistent with full year annual report figures.
This article by Simply Wall St is general in nature. It does not constitute a recommendation to buy or sell any stock, and does not take account of your objectives, or your financial situation. We aim to bring you long-term focused analysis driven by fundamental data. Note that our analysis may not factor in the latest price-sensitive company announcements or qualitative material. Simply Wall St has no position in any stocks mentioned.
Have feedback on this article? Concerned about the content? Get in touch with us directly. Alternatively, email editorial-team (at) simplywallst.com.
