Do You Know What Agilent Technologies, Inc.'s (NYSE:A) P/E Ratio Means?

This article is written for those who want to get better at using price to earnings ratios (P/E ratios). To keep it practical, we'll show how Agilent Technologies, Inc.'s (NYSE:A) P/E ratio could help you assess the value on offer. Looking at earnings over the last twelve months, Agilent Technologies has a P/E ratio of 24.78. That means that at current prices, buyers pay $24.78 for every $1 in trailing yearly profits.
View our latest analysis for Agilent Technologies
How Do I Calculate Agilent Technologies's Price To Earnings Ratio?
The formula for P/E is:
Price to Earnings Ratio = Price per Share ÷ Earnings per Share (EPS)
Or for Agilent Technologies:
P/E of 24.78 = $84.51 ÷ $3.41 (Based on the year to October 2019.)
Is A High Price-to-Earnings Ratio Good?
The higher the P/E ratio, the higher the price tag of a business, relative to its trailing earnings. That is not a good or a bad thing per se, but a high P/E does imply buyers are optimistic about the future.
Does Agilent Technologies Have A Relatively High Or Low P/E For Its Industry?
The P/E ratio indicates whether the market has higher or lower expectations of a company. The image below shows that Agilent Technologies has a lower P/E than the average (36.0) P/E for companies in the life sciences industry.
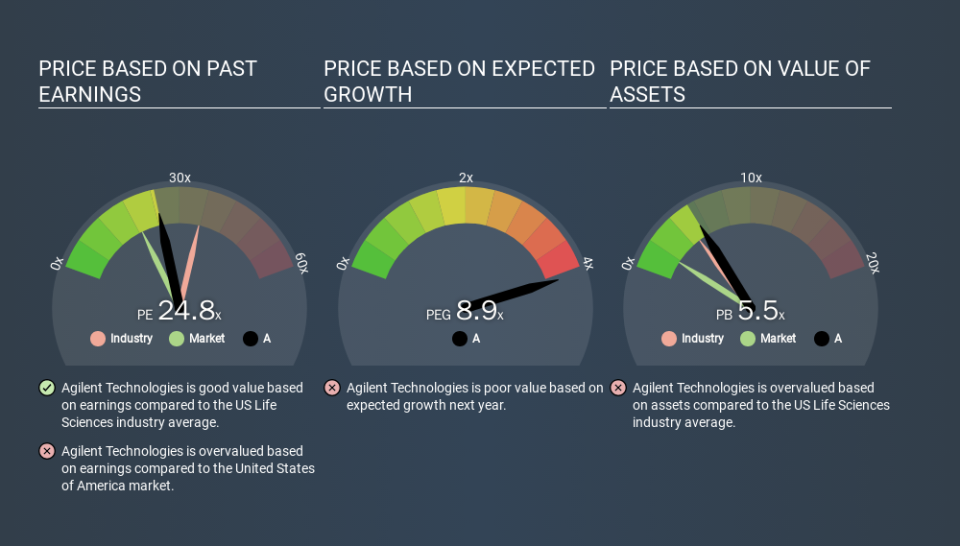
Its relatively low P/E ratio indicates that Agilent Technologies shareholders think it will struggle to do as well as other companies in its industry classification. Since the market seems unimpressed with Agilent Technologies, it's quite possible it could surprise on the upside. You should delve deeper. I like to check if company insiders have been buying or selling.
How Growth Rates Impact P/E Ratios
Earnings growth rates have a big influence on P/E ratios. If earnings are growing quickly, then the 'E' in the equation will increase faster than it would otherwise. And in that case, the P/E ratio itself will drop rather quickly. And as that P/E ratio drops, the company will look cheap, unless its share price increases.
Agilent Technologies's 246% EPS improvement over the last year was like bamboo growth after rain; rapid and impressive. The cherry on top is that the five year growth rate was an impressive 37% per year. With that kind of growth rate we would generally expect a high P/E ratio.
Don't Forget: The P/E Does Not Account For Debt or Bank Deposits
It's important to note that the P/E ratio considers the market capitalization, not the enterprise value. Thus, the metric does not reflect cash or debt held by the company. Hypothetically, a company could reduce its future P/E ratio by spending its cash (or taking on debt) to achieve higher earnings.
Such expenditure might be good or bad, in the long term, but the point here is that the balance sheet is not reflected by this ratio.
So What Does Agilent Technologies's Balance Sheet Tell Us?
Agilent Technologies's net debt is 4.0% of its market cap. It would probably trade on a higher P/E ratio if it had a lot of cash, but I doubt it is having a big impact.
The Bottom Line On Agilent Technologies's P/E Ratio
Agilent Technologies has a P/E of 24.8. That's higher than the average in its market, which is 18.9. While the company does use modest debt, its recent earnings growth is superb. So on this analysis a high P/E ratio seems reasonable.
Investors have an opportunity when market expectations about a stock are wrong. As value investor Benjamin Graham famously said, 'In the short run, the market is a voting machine but in the long run, it is a weighing machine. So this free visualization of the analyst consensus on future earnings could help you make the right decision about whether to buy, sell, or hold.
Of course, you might find a fantastic investment by looking at a few good candidates. So take a peek at this free list of companies with modest (or no) debt, trading on a P/E below 20.
If you spot an error that warrants correction, please contact the editor at editorial-team@simplywallst.com. This article by Simply Wall St is general in nature. It does not constitute a recommendation to buy or sell any stock, and does not take account of your objectives, or your financial situation. Simply Wall St has no position in the stocks mentioned.
We aim to bring you long-term focused research analysis driven by fundamental data. Note that our analysis may not factor in the latest price-sensitive company announcements or qualitative material. Thank you for reading.
