Do You Know What Alumina Limited's (ASX:AWC) P/E Ratio Means?

This article is written for those who want to get better at using price to earnings ratios (P/E ratios). To keep it practical, we'll show how Alumina Limited's (ASX:AWC) P/E ratio could help you assess the value on offer. Alumina has a price to earnings ratio of 7.61, based on the last twelve months. That corresponds to an earnings yield of approximately 13%.
Want to participate in a short research study? Help shape the future of investing tools and you could win a $250 gift card!
Check out our latest analysis for Alumina
How Do You Calculate A P/E Ratio?
The formula for P/E is:
Price to Earnings Ratio = Share Price (in reporting currency) ÷ Earnings per Share (EPS)
Or for Alumina:
P/E of 7.61 = $1.68 (Note: this is the share price in the reporting currency, namely, USD ) ÷ $0.22 (Based on the trailing twelve months to December 2018.)
Is A High Price-to-Earnings Ratio Good?
The higher the P/E ratio, the higher the price tag of a business, relative to its trailing earnings. That isn't necessarily good or bad, but a high P/E implies relatively high expectations of what a company can achieve in the future.
How Growth Rates Impact P/E Ratios
P/E ratios primarily reflect market expectations around earnings growth rates. When earnings grow, the 'E' increases, over time. That means even if the current P/E is high, it will reduce over time if the share price stays flat. Then, a lower P/E should attract more buyers, pushing the share price up.
Alumina's earnings made like a rocket, taking off 87% last year. The sweetener is that the annual five year growth rate of 314% is also impressive. So I'd be surprised if the P/E ratio was not above average.
How Does Alumina's P/E Ratio Compare To Its Peers?
We can get an indication of market expectations by looking at the P/E ratio. The image below shows that Alumina has a lower P/E than the average (11.9) P/E for companies in the metals and mining industry.
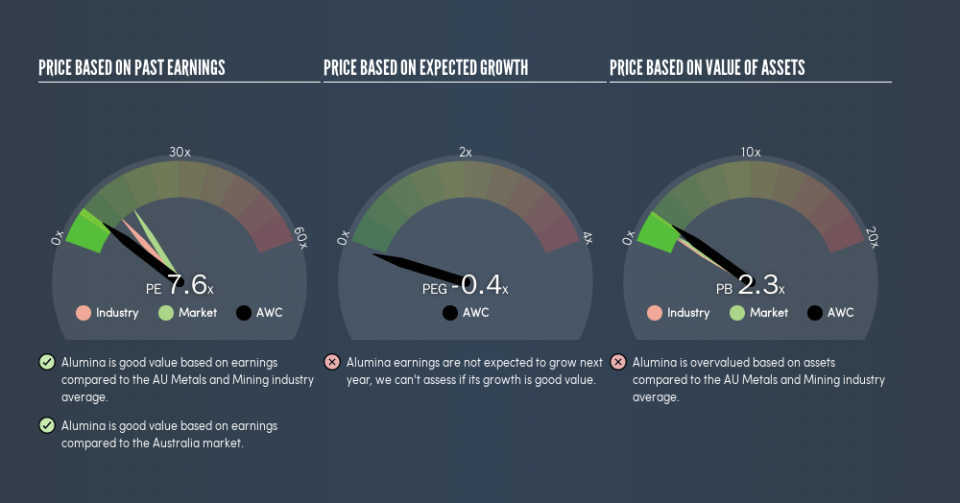
Alumina's P/E tells us that market participants think it will not fare as well as its peers in the same industry. Since the market seems unimpressed with Alumina, it's quite possible it could surprise on the upside. You should delve deeper. I like to check if company insiders have been buying or selling.
A Limitation: P/E Ratios Ignore Debt and Cash In The Bank
The 'Price' in P/E reflects the market capitalization of the company. That means it doesn't take debt or cash into account. Hypothetically, a company could reduce its future P/E ratio by spending its cash (or taking on debt) to achieve higher earnings.
Spending on growth might be good or bad a few years later, but the point is that the P/E ratio does not account for the option (or lack thereof).
Alumina's Balance Sheet
The extra options and safety that comes with Alumina's US$77m net cash position means that it deserves a higher P/E than it would if it had a lot of net debt.
The Verdict On Alumina's P/E Ratio
Alumina trades on a P/E ratio of 7.6, which is below the AU market average of 16.2. It grew its EPS nicely over the last year, and the healthy balance sheet implies there is more potential for growth. The below average P/E ratio suggests that market participants don't believe the strong growth will continue.
Investors have an opportunity when market expectations about a stock are wrong. If the reality for a company is not as bad as the P/E ratio indicates, then the share price should increase as the market realizes this. So this free visual report on analyst forecasts could hold the key to an excellent investment decision.
You might be able to find a better buy than Alumina. If you want a selection of possible winners, check out this free list of interesting companies that trade on a P/E below 20 (but have proven they can grow earnings).
We aim to bring you long-term focused research analysis driven by fundamental data. Note that our analysis may not factor in the latest price-sensitive company announcements or qualitative material.
If you spot an error that warrants correction, please contact the editor at editorial-team@simplywallst.com. This article by Simply Wall St is general in nature. It does not constitute a recommendation to buy or sell any stock, and does not take account of your objectives, or your financial situation. Simply Wall St has no position in the stocks mentioned. Thank you for reading.
