Do You Know What AMC Networks Inc.’s (NASDAQ:AMCX) P/E Ratio Means?

Want to participate in a short research study? Help shape the future of investing tools and receive a $20 prize!
This article is for investors who would like to improve their understanding of price to earnings ratios (P/E ratios). We’ll look at AMC Networks Inc.’s (NASDAQ:AMCX) P/E ratio and reflect on what it tells us about the company’s share price. AMC Networks has a price to earnings ratio of 7.27, based on the last twelve months. In other words, at today’s prices, investors are paying $7.27 for every $1 in prior year profit.
Check out our latest analysis for AMC Networks
How Do You Calculate A P/E Ratio?
The formula for P/E is:
Price to Earnings Ratio = Share Price ÷ Earnings per Share (EPS)
Or for AMC Networks:
P/E of 7.27 = $63.74 ÷ $8.76 (Based on the year to September 2018.)
Is A High P/E Ratio Good?
A higher P/E ratio means that buyers have to pay a higher price for each $1 the company has earned over the last year. That isn’t a good or a bad thing on its own, but a high P/E means that buyers have a higher opinion of the business’s prospects, relative to stocks with a lower P/E.
How Growth Rates Impact P/E Ratios
Earnings growth rates have a big influence on P/E ratios. Earnings growth means that in the future the ‘E’ will be higher. That means unless the share price increases, the P/E will reduce in a few years. Then, a lower P/E should attract more buyers, pushing the share price up.
AMC Networks increased earnings per share by a whopping 73% last year. And it has bolstered its earnings per share by 16% per year over the last five years. So we’d generally expect it to have a relatively high P/E ratio.
How Does AMC Networks’s P/E Ratio Compare To Its Peers?
The P/E ratio essentially measures market expectations of a company. We can see in the image below that the average P/E (12.5) for companies in the media industry is higher than AMC Networks’s P/E.
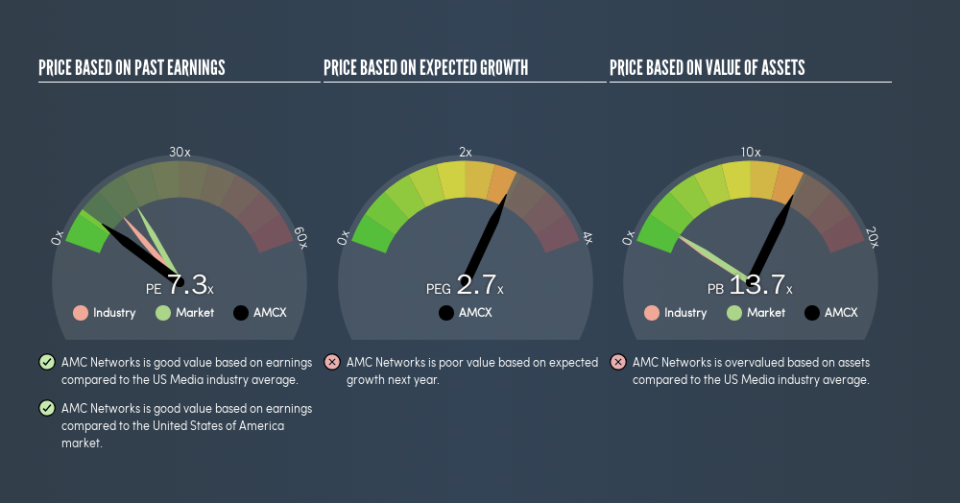
AMC Networks’s P/E tells us that market participants think it will not fare as well as its peers in the same industry. While current expectations are low, the stock could be undervalued if the situation is better than the market assumes. It is arguably worth checking if insiders are buying shares, because that might imply they believe the stock is undervalued.
Remember: P/E Ratios Don’t Consider The Balance Sheet
It’s important to note that the P/E ratio considers the market capitalization, not the enterprise value. Thus, the metric does not reflect cash or debt held by the company. Hypothetically, a company could reduce its future P/E ratio by spending its cash (or taking on debt) to achieve higher earnings.
Such expenditure might be good or bad, in the long term, but the point here is that the balance sheet is not reflected by this ratio.
Is Debt Impacting AMC Networks’s P/E?
AMC Networks has net debt worth 70% of its market capitalization. If you want to compare its P/E ratio to other companies, you should absolutely keep in mind it has significant borrowings.
The Bottom Line On AMC Networks’s P/E Ratio
AMC Networks’s P/E is 7.3 which is below average (17.5) in the US market. The company may have significant debt, but EPS growth was good last year. The low P/E ratio suggests current market expectations are muted, implying these levels of growth will not continue.
When the market is wrong about a stock, it gives savvy investors an opportunity. If it is underestimating a company, investors can make money by buying and holding the shares until the market corrects itself. So this free visual report on analyst forecasts could hold the key to an excellent investment decision.
Of course you might be able to find a better stock than AMC Networks. So you may wish to see this free collection of other companies that have grown earnings strongly.
We aim to bring you long-term focused research analysis driven by fundamental data. Note that our analysis may not factor in the latest price-sensitive company announcements or qualitative material.
If you spot an error that warrants correction, please contact the editor at editorial-team@simplywallst.com. This article by Simply Wall St is general in nature. It does not constitute a recommendation to buy or sell any stock, and does not take account of your objectives, or your financial situation. Simply Wall St has no position in the stocks mentioned. Thank you for reading.
