Do You Know What Booking Holdings Inc.'s (NASDAQ:BKNG) P/E Ratio Means?

The goal of this article is to teach you how to use price to earnings ratios (P/E ratios). We'll look at Booking Holdings Inc.'s (NASDAQ:BKNG) P/E ratio and reflect on what it tells us about the company's share price. Looking at earnings over the last twelve months, Booking Holdings has a P/E ratio of 21.23. That corresponds to an earnings yield of approximately 4.7%.
Check out our latest analysis for Booking Holdings
How Do I Calculate Booking Holdings's Price To Earnings Ratio?
The formula for P/E is:
Price to Earnings Ratio = Price per Share ÷ Earnings per Share (EPS)
Or for Booking Holdings:
P/E of 21.23 = $1943.19 ÷ $91.55 (Based on the year to June 2019.)
Is A High Price-to-Earnings Ratio Good?
A higher P/E ratio implies that investors pay a higher price for the earning power of the business. That is not a good or a bad thing per se, but a high P/E does imply buyers are optimistic about the future.
Does Booking Holdings Have A Relatively High Or Low P/E For Its Industry?
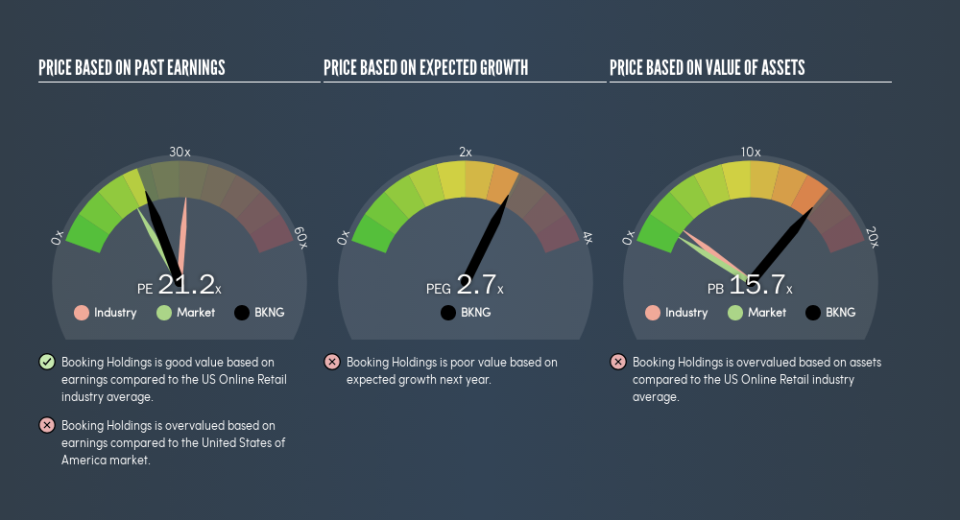
The P/E ratio essentially measures market expectations of a company. If you look at the image below, you can see Booking Holdings has a lower P/E than the average (32.5) in the online retail industry classification.
Its relatively low P/E ratio indicates that Booking Holdings shareholders think it will struggle to do as well as other companies in its industry classification. Many investors like to buy stocks when the market is pessimistic about their prospects. It is arguably worth checking if insiders are buying shares, because that might imply they believe the stock is undervalued.
How Growth Rates Impact P/E Ratios
P/E ratios primarily reflect market expectations around earnings growth rates. When earnings grow, the 'E' increases, over time. Therefore, even if you pay a high multiple of earnings now, that multiple will become lower in the future. And as that P/E ratio drops, the company will look cheap, unless its share price increases.
In the last year, Booking Holdings grew EPS like Taylor Swift grew her fan base back in 2010; the 61% gain was both fast and well deserved. The sweetener is that the annual five year growth rate of 18% is also impressive. So I'd be surprised if the P/E ratio was not above average.
Remember: P/E Ratios Don't Consider The Balance Sheet
Don't forget that the P/E ratio considers market capitalization. In other words, it does not consider any debt or cash that the company may have on the balance sheet. Theoretically, a business can improve its earnings (and produce a lower P/E in the future) by investing in growth. That means taking on debt (or spending its cash).
Such spending might be good or bad, overall, but the key point here is that you need to look at debt to understand the P/E ratio in context.
So What Does Booking Holdings's Balance Sheet Tell Us?
Booking Holdings has net debt worth just 2.2% of its market capitalization. The market might award it a higher P/E ratio if it had net cash, but its unlikely this low level of net borrowing is having a big impact on the P/E multiple.
The Verdict On Booking Holdings's P/E Ratio
Booking Holdings has a P/E of 21.2. That's higher than the average in its market, which is 17.3. Its debt levels do not imperil its balance sheet and its EPS growth is very healthy indeed. So on this analysis a high P/E ratio seems reasonable.
When the market is wrong about a stock, it gives savvy investors an opportunity. As value investor Benjamin Graham famously said, 'In the short run, the market is a voting machine but in the long run, it is a weighing machine.' So this free report on the analyst consensus forecasts could help you make a master move on this stock.
Of course you might be able to find a better stock than Booking Holdings. So you may wish to see this free collection of other companies that have grown earnings strongly.
We aim to bring you long-term focused research analysis driven by fundamental data. Note that our analysis may not factor in the latest price-sensitive company announcements or qualitative material.
If you spot an error that warrants correction, please contact the editor at editorial-team@simplywallst.com. This article by Simply Wall St is general in nature. It does not constitute a recommendation to buy or sell any stock, and does not take account of your objectives, or your financial situation. Simply Wall St has no position in the stocks mentioned. Thank you for reading.
