Do You Know What Chicago Rivet & Machine Co.'s (NYSEMKT:CVR) P/E Ratio Means?

To the annoyance of some shareholders, Chicago Rivet & Machine (NYSEMKT:CVR) shares are down a considerable in the last month. The recent drop has obliterated the annual return, with the share price now down 20% over that longer period.
Assuming no other changes, a sharply higher share price makes a stock less attractive to potential buyers. In the long term, share prices tend to follow earnings per share, but in the short term prices bounce around in response to short term factors (which are not always obvious). So some would prefer to hold off buying when there is a lot of optimism towards a stock. Perhaps the simplest way to get a read on investors' expectations of a business is to look at its Price to Earnings Ratio (PE Ratio). A high P/E implies that investors have high expectations of what a company can achieve compared to a company with a low P/E ratio.
See our latest analysis for Chicago Rivet & Machine
Does Chicago Rivet & Machine Have A Relatively High Or Low P/E For Its Industry?
Chicago Rivet & Machine has a P/E ratio of 21.94. You can see in the image below that the average P/E (22.9) for companies in the machinery industry is roughly the same as Chicago Rivet & Machine's P/E.
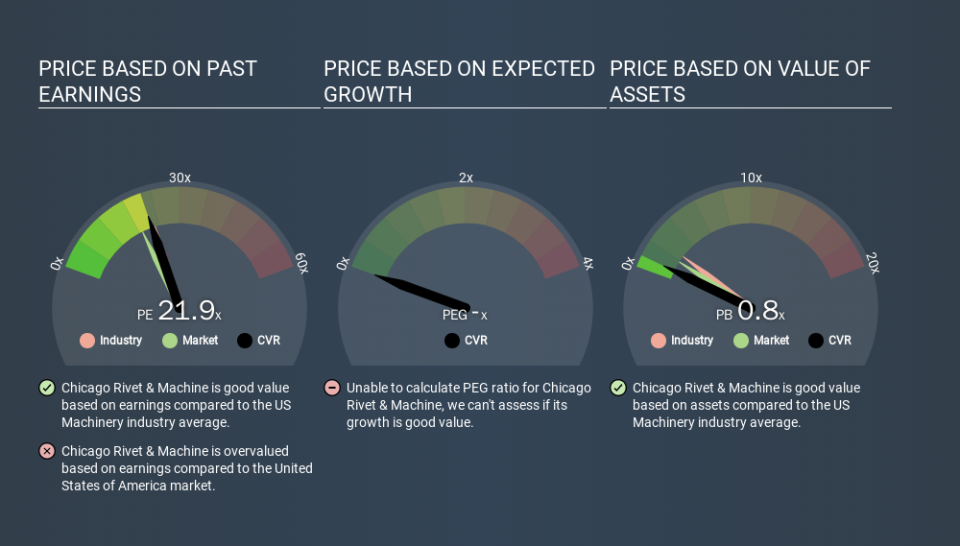
That indicates that the market expects Chicago Rivet & Machine will perform roughly in line with other companies in its industry. The company could surprise by performing better than average, in the future. Checking factors such as director buying and selling. could help you form your own view on if that will happen.
How Growth Rates Impact P/E Ratios
If earnings fall then in the future the 'E' will be lower. Therefore, even if you pay a low multiple of earnings now, that multiple will become higher in the future. So while a stock may look cheap based on past earnings, it could be expensive based on future earnings.
Chicago Rivet & Machine shrunk earnings per share by 54% over the last year. And it has shrunk its earnings per share by 13% per year over the last five years. This could justify a pessimistic P/E.
Remember: P/E Ratios Don't Consider The Balance Sheet
Don't forget that the P/E ratio considers market capitalization. Thus, the metric does not reflect cash or debt held by the company. In theory, a company can lower its future P/E ratio by using cash or debt to invest in growth.
Such spending might be good or bad, overall, but the key point here is that you need to look at debt to understand the P/E ratio in context.
Chicago Rivet & Machine's Balance Sheet
Chicago Rivet & Machine has net cash of US$7.3m. This is fairly high at 29% of its market capitalization. That might mean balance sheet strength is important to the business, but should also help push the P/E a bit higher than it would otherwise be.
The Verdict On Chicago Rivet & Machine's P/E Ratio
Chicago Rivet & Machine has a P/E of 21.9. That's higher than the average in its market, which is 18.9. The recent drop in earnings per share would make some investors cautious, but the net cash position means the company has time to improve: and the high P/E suggests the market thinks it will. Given Chicago Rivet & Machine's P/E ratio has declined from 21.9 to 21.9 in the last month, we know for sure that the market is less confident about the business today, than it was back then. For those who prefer to invest with the flow of momentum, that might be a bad sign, but for a contrarian, it may signal opportunity.
Investors have an opportunity when market expectations about a stock are wrong. As value investor Benjamin Graham famously said, 'In the short run, the market is a voting machine but in the long run, it is a weighing machine. We don't have analyst forecasts, but shareholders might want to examine this detailed historical graph of earnings, revenue and cash flow.
But note: Chicago Rivet & Machine may not be the best stock to buy. So take a peek at this free list of interesting companies with strong recent earnings growth (and a P/E ratio below 20).
If you spot an error that warrants correction, please contact the editor at editorial-team@simplywallst.com. This article by Simply Wall St is general in nature. It does not constitute a recommendation to buy or sell any stock, and does not take account of your objectives, or your financial situation. Simply Wall St has no position in the stocks mentioned.
We aim to bring you long-term focused research analysis driven by fundamental data. Note that our analysis may not factor in the latest price-sensitive company announcements or qualitative material. Thank you for reading.
