Do You Know What Faes Farma, S.A.'s (BME:FAE) P/E Ratio Means?

Today, we'll introduce the concept of the P/E ratio for those who are learning about investing. To keep it practical, we'll show how Faes Farma, S.A.'s (BME:FAE) P/E ratio could help you assess the value on offer. Based on the last twelve months, Faes Farma's P/E ratio is 22.95. In other words, at today's prices, investors are paying €22.95 for every €1 in prior year profit.
View our latest analysis for Faes Farma
How Do You Calculate A P/E Ratio?
The formula for price to earnings is:
Price to Earnings Ratio = Share Price ÷ Earnings per Share (EPS)
Or for Faes Farma:
P/E of 22.95 = €5.25 ÷ €0.23 (Based on the trailing twelve months to September 2019.)
Is A High Price-to-Earnings Ratio Good?
The higher the P/E ratio, the higher the price tag of a business, relative to its trailing earnings. All else being equal, it's better to pay a low price -- but as Warren Buffett said, 'It's far better to buy a wonderful company at a fair price than a fair company at a wonderful price'.
Does Faes Farma Have A Relatively High Or Low P/E For Its Industry?
The P/E ratio essentially measures market expectations of a company. The image below shows that Faes Farma has a P/E ratio that is roughly in line with the pharmaceuticals industry average (23.7).
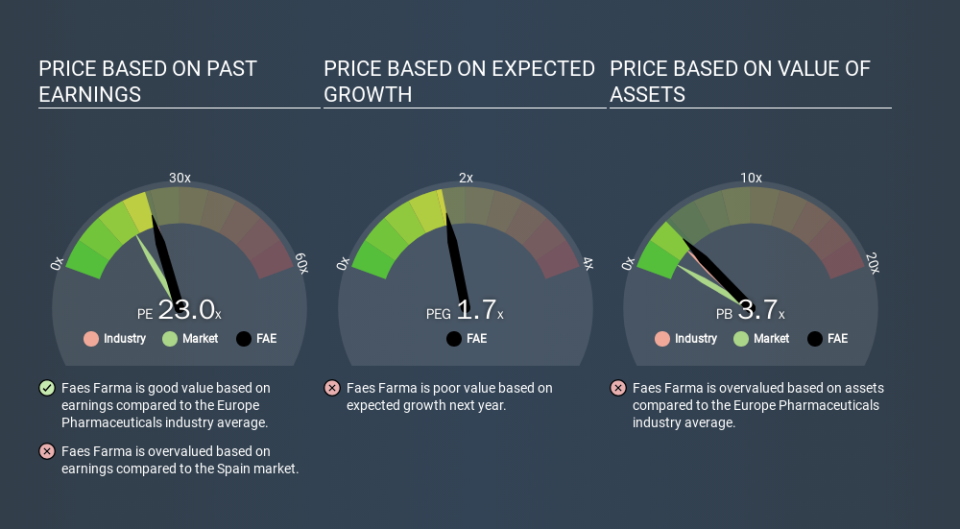
Its P/E ratio suggests that Faes Farma shareholders think that in the future it will perform about the same as other companies in its industry classification. If the company has better than average prospects, then the market might be underestimating it. Checking factors such as director buying and selling. could help you form your own view on if that will happen.
How Growth Rates Impact P/E Ratios
Probably the most important factor in determining what P/E a company trades on is the earnings growth. Earnings growth means that in the future the 'E' will be higher. Therefore, even if you pay a high multiple of earnings now, that multiple will become lower in the future. And as that P/E ratio drops, the company will look cheap, unless its share price increases.
It's great to see that Faes Farma grew EPS by 20% in the last year.
Don't Forget: The P/E Does Not Account For Debt or Bank Deposits
Don't forget that the P/E ratio considers market capitalization. Thus, the metric does not reflect cash or debt held by the company. In theory, a company can lower its future P/E ratio by using cash or debt to invest in growth.
Such spending might be good or bad, overall, but the key point here is that you need to look at debt to understand the P/E ratio in context.
So What Does Faes Farma's Balance Sheet Tell Us?
The extra options and safety that comes with Faes Farma's €40m net cash position means that it deserves a higher P/E than it would if it had a lot of net debt.
The Verdict On Faes Farma's P/E Ratio
Faes Farma's P/E is 23.0 which is above average (16.8) in its market. Its strong balance sheet gives the company plenty of resources for extra growth, and it has already proven it can grow. So it is not surprising the market is probably extrapolating recent growth well into the future, reflected in the relatively high P/E ratio.
Investors have an opportunity when market expectations about a stock are wrong. If the reality for a company is better than it expects, you can make money by buying and holding for the long term. So this free visualization of the analyst consensus on future earnings could help you make the right decision about whether to buy, sell, or hold.
But note: Faes Farma may not be the best stock to buy. So take a peek at this free list of interesting companies with strong recent earnings growth (and a P/E ratio below 20).
If you spot an error that warrants correction, please contact the editor at editorial-team@simplywallst.com. This article by Simply Wall St is general in nature. It does not constitute a recommendation to buy or sell any stock, and does not take account of your objectives, or your financial situation. Simply Wall St has no position in the stocks mentioned.
We aim to bring you long-term focused research analysis driven by fundamental data. Note that our analysis may not factor in the latest price-sensitive company announcements or qualitative material. Thank you for reading.
