Do You Know What Koda Ltd's (SGX:BJZ) P/E Ratio Means?

This article is for investors who would like to improve their understanding of price to earnings ratios (P/E ratios). To keep it practical, we'll show how Koda Ltd's (SGX:BJZ) P/E ratio could help you assess the value on offer. Koda has a P/E ratio of 6.95, based on the last twelve months. That means that at current prices, buyers pay SGD6.95 for every SGD1 in trailing yearly profits.
See our latest analysis for Koda
How Do I Calculate A Price To Earnings Ratio?
The formula for price to earnings is:
Price to Earnings Ratio = Share Price (in reporting currency) ÷ Earnings per Share (EPS)
Or for Koda:
P/E of 6.95 = USD0.41 (Note: this is the share price in the reporting currency, namely, USD ) ÷ USD0.06 (Based on the trailing twelve months to September 2019.)
Is A High Price-to-Earnings Ratio Good?
A higher P/E ratio implies that investors pay a higher price for the earning power of the business. That is not a good or a bad thing per se, but a high P/E does imply buyers are optimistic about the future.
How Does Koda's P/E Ratio Compare To Its Peers?
The P/E ratio indicates whether the market has higher or lower expectations of a company. The image below shows that Koda has a lower P/E than the average (15.2) P/E for companies in the consumer durables industry.
Koda's P/E tells us that market participants think it will not fare as well as its peers in the same industry. Since the market seems unimpressed with Koda, it's quite possible it could surprise on the upside. You should delve deeper. I like to check if company insiders have been buying or selling.
How Growth Rates Impact P/E Ratios
Earnings growth rates have a big influence on P/E ratios. Earnings growth means that in the future the 'E' will be higher. That means unless the share price increases, the P/E will reduce in a few years. So while a stock may look expensive based on past earnings, it could be cheap based on future earnings.
Koda shrunk earnings per share by 19% over the last year. But over the longer term (3 years), earnings per share have increased by 42%.
Don't Forget: The P/E Does Not Account For Debt or Bank Deposits
One drawback of using a P/E ratio is that it considers market capitalization, but not the balance sheet. That means it doesn't take debt or cash into account. Hypothetically, a company could reduce its future P/E ratio by spending its cash (or taking on debt) to achieve higher earnings.
Such expenditure might be good or bad, in the long term, but the point here is that the balance sheet is not reflected by this ratio.
Is Debt Impacting Koda's P/E?
With net cash of US$15m, Koda has a very strong balance sheet, which may be important for its business. Having said that, at 43% of its market capitalization the cash hoard would contribute towards a higher P/E ratio.
The Verdict On Koda's P/E Ratio
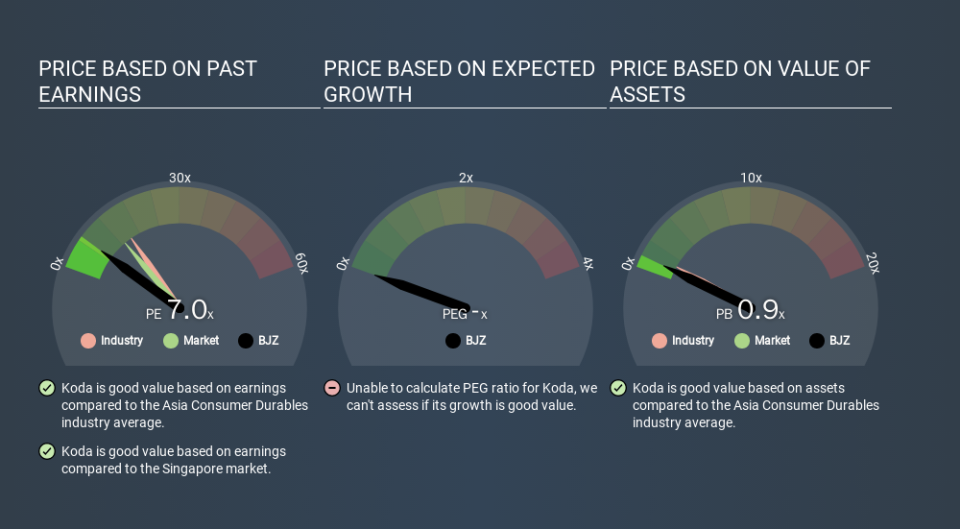
Koda has a P/E of 7.0. That's below the average in the SG market, which is 13.0. The recent drop in earnings per share would make investors cautious, the relatively strong balance sheet will allow the company time to invest in growth. If it achieves that, then there's real potential that the low P/E could eventually indicate undervaluation.
When the market is wrong about a stock, it gives savvy investors an opportunity. As value investor Benjamin Graham famously said, 'In the short run, the market is a voting machine but in the long run, it is a weighing machine. Although we don't have analyst forecasts you might want to assess this data-rich visualization of earnings, revenue and cash flow.
But note: Koda may not be the best stock to buy. So take a peek at this free list of interesting companies with strong recent earnings growth (and a P/E ratio below 20).
If you spot an error that warrants correction, please contact the editor at editorial-team@simplywallst.com. This article by Simply Wall St is general in nature. It does not constitute a recommendation to buy or sell any stock, and does not take account of your objectives, or your financial situation. Simply Wall St has no position in the stocks mentioned.
We aim to bring you long-term focused research analysis driven by fundamental data. Note that our analysis may not factor in the latest price-sensitive company announcements or qualitative material. Thank you for reading.
