Do You Know What Oxford Metrics Plc's (LON:OMG) P/E Ratio Means?

Want to participate in a short research study? Help shape the future of investing tools and you could win a $250 gift card!
This article is written for those who want to get better at using price to earnings ratios (P/E ratios). We'll look at Oxford Metrics Plc's (LON:OMG) P/E ratio and reflect on what it tells us about the company's share price. Oxford Metrics has a price to earnings ratio of 27.13, based on the last twelve months. That corresponds to an earnings yield of approximately 3.7%.
View our latest analysis for Oxford Metrics
How Do I Calculate A Price To Earnings Ratio?
The formula for price to earnings is:
Price to Earnings Ratio = Share Price ÷ Earnings per Share (EPS)
Or for Oxford Metrics:
P/E of 27.13 = £0.95 ÷ £0.035 (Based on the trailing twelve months to March 2019.)
Is A High P/E Ratio Good?
A higher P/E ratio implies that investors pay a higher price for the earning power of the business. That isn't necessarily good or bad, but a high P/E implies relatively high expectations of what a company can achieve in the future.
How Growth Rates Impact P/E Ratios
When earnings fall, the 'E' decreases, over time. That means unless the share price falls, the P/E will increase in a few years. So while a stock may look cheap based on past earnings, it could be expensive based on future earnings.
Oxford Metrics's earnings made like a rocket, taking off 86% last year. The sweetener is that the annual five year growth rate of 57% is also impressive. So I'd be surprised if the P/E ratio was not above average. Unfortunately, earnings per share are down 13% a year, over 3 years.
How Does Oxford Metrics's P/E Ratio Compare To Its Peers?
The P/E ratio essentially measures market expectations of a company. If you look at the image below, you can see Oxford Metrics has a lower P/E than the average (29.8) in the software industry classification.
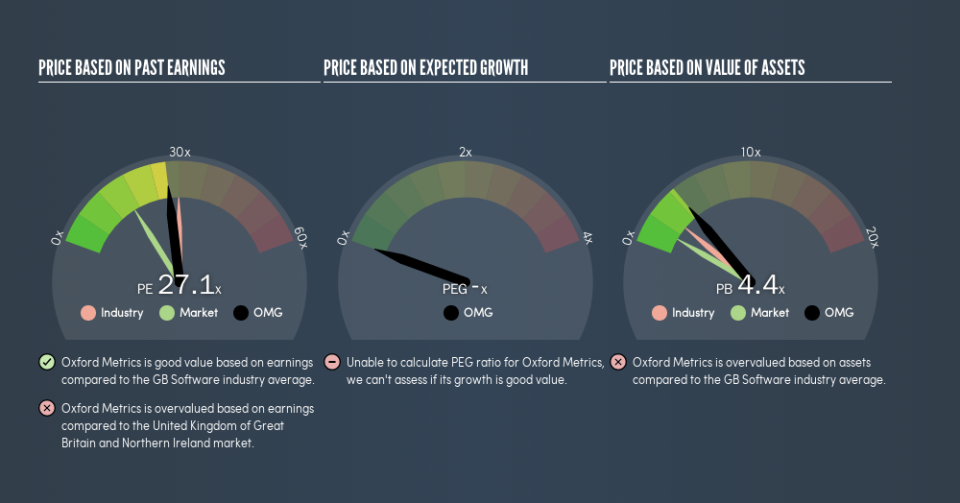
This suggests that market participants think Oxford Metrics will underperform other companies in its industry. Many investors like to buy stocks when the market is pessimistic about their prospects. If you consider the stock interesting, further research is recommended. For example, I often monitor director buying and selling.
Don't Forget: The P/E Does Not Account For Debt or Bank Deposits
Don't forget that the P/E ratio considers market capitalization. So it won't reflect the advantage of cash, or disadvantage of debt. Hypothetically, a company could reduce its future P/E ratio by spending its cash (or taking on debt) to achieve higher earnings.
Such spending might be good or bad, overall, but the key point here is that you need to look at debt to understand the P/E ratio in context.
Oxford Metrics's Balance Sheet
Since Oxford Metrics holds net cash of UK£11m, it can spend on growth, justifying a higher P/E ratio than otherwise.
The Bottom Line On Oxford Metrics's P/E Ratio
Oxford Metrics's P/E is 27.1 which is above average (16.3) in the GB market. Its net cash position is the cherry on top of its superb EPS growth. So based on this analysis we'd expect Oxford Metrics to have a high P/E ratio.
When the market is wrong about a stock, it gives savvy investors an opportunity. If the reality for a company is better than it expects, you can make money by buying and holding for the long term. So this free visual report on analyst forecasts could hold the key to an excellent investment decision.
Of course, you might find a fantastic investment by looking at a few good candidates. So take a peek at this free list of companies with modest (or no) debt, trading on a P/E below 20.
We aim to bring you long-term focused research analysis driven by fundamental data. Note that our analysis may not factor in the latest price-sensitive company announcements or qualitative material.
If you spot an error that warrants correction, please contact the editor at editorial-team@simplywallst.com. This article by Simply Wall St is general in nature. It does not constitute a recommendation to buy or sell any stock, and does not take account of your objectives, or your financial situation. Simply Wall St has no position in the stocks mentioned. Thank you for reading.
