Do You Know What TransAct Technologies Incorporated's (NASDAQ:TACT) P/E Ratio Means?

Want to participate in a short research study? Help shape the future of investing tools and you could win a $250 gift card!
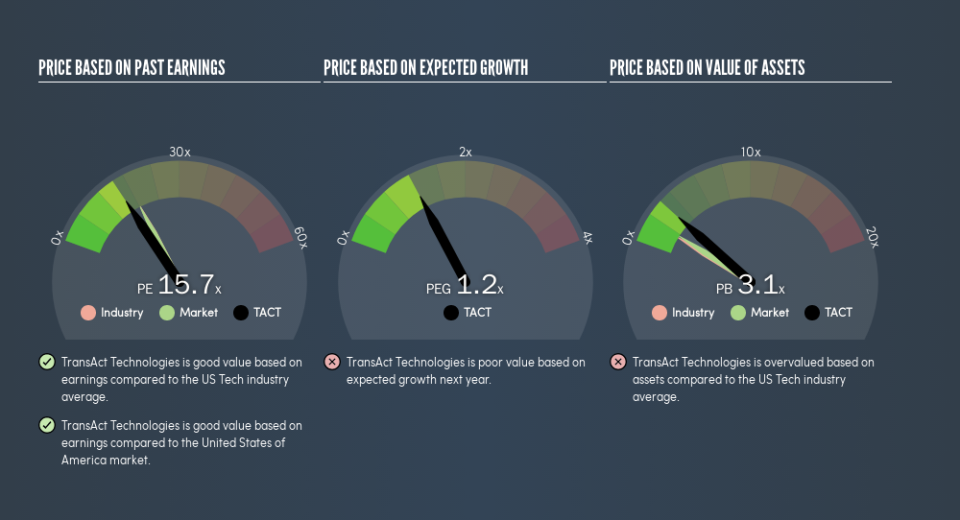
This article is written for those who want to get better at using price to earnings ratios (P/E ratios). To keep it practical, we'll show how TransAct Technologies Incorporated's (NASDAQ:TACT) P/E ratio could help you assess the value on offer. What is TransAct Technologies's P/E ratio? Well, based on the last twelve months it is 15.67. That means that at current prices, buyers pay $15.67 for every $1 in trailing yearly profits.
See our latest analysis for TransAct Technologies
How Do I Calculate A Price To Earnings Ratio?
The formula for price to earnings is:
Price to Earnings Ratio = Price per Share ÷ Earnings per Share (EPS)
Or for TransAct Technologies:
P/E of 15.67 = $11.59 ÷ $0.74 (Based on the year to March 2019.)
Is A High Price-to-Earnings Ratio Good?
A higher P/E ratio implies that investors pay a higher price for the earning power of the business. That is not a good or a bad thing per se, but a high P/E does imply buyers are optimistic about the future.
How Growth Rates Impact P/E Ratios
Earnings growth rates have a big influence on P/E ratios. That's because companies that grow earnings per share quickly will rapidly increase the 'E' in the equation. That means even if the current P/E is high, it will reduce over time if the share price stays flat. So while a stock may look expensive based on past earnings, it could be cheap based on future earnings.
TransAct Technologies's earnings made like a rocket, taking off 87% last year. And earnings per share have improved by 17% annually, over the last three years. So we'd absolutely expect it to have a relatively high P/E ratio.
How Does TransAct Technologies's P/E Ratio Compare To Its Peers?
We can get an indication of market expectations by looking at the P/E ratio. We can see in the image below that the average P/E (18.3) for companies in the tech industry is higher than TransAct Technologies's P/E.
This suggests that market participants think TransAct Technologies will underperform other companies in its industry. Many investors like to buy stocks when the market is pessimistic about their prospects. If you consider the stock interesting, further research is recommended. For example, I often monitor director buying and selling.
Remember: P/E Ratios Don't Consider The Balance Sheet
Don't forget that the P/E ratio considers market capitalization. Thus, the metric does not reflect cash or debt held by the company. In theory, a company can lower its future P/E ratio by using cash or debt to invest in growth.
Such spending might be good or bad, overall, but the key point here is that you need to look at debt to understand the P/E ratio in context.
How Does TransAct Technologies's Debt Impact Its P/E Ratio?
TransAct Technologies has net cash of US$1.9m. That should lead to a higher P/E than if it did have debt, because its strong balance sheets gives it more options.
The Verdict On TransAct Technologies's P/E Ratio
TransAct Technologies has a P/E of 15.7. That's below the average in the US market, which is 18.2. It grew its EPS nicely over the last year, and the healthy balance sheet implies there is more potential for growth. The relatively low P/E ratio implies the market is pessimistic.
Investors should be looking to buy stocks that the market is wrong about. If the reality for a company is not as bad as the P/E ratio indicates, then the share price should increase as the market realizes this. So this free visualization of the analyst consensus on future earnings could help you make the right decision about whether to buy, sell, or hold.
Of course you might be able to find a better stock than TransAct Technologies. So you may wish to see this free collection of other companies that have grown earnings strongly.
We aim to bring you long-term focused research analysis driven by fundamental data. Note that our analysis may not factor in the latest price-sensitive company announcements or qualitative material.
If you spot an error that warrants correction, please contact the editor at editorial-team@simplywallst.com. This article by Simply Wall St is general in nature. It does not constitute a recommendation to buy or sell any stock, and does not take account of your objectives, or your financial situation. Simply Wall St has no position in the stocks mentioned. Thank you for reading.
