Is L.G. Balakrishnan & Bros Limited (NSE:LGBBROSLTD) A High Quality Stock To Own?

Want to participate in a short research study? Help shape the future of investing tools and you could win a $250 gift card!
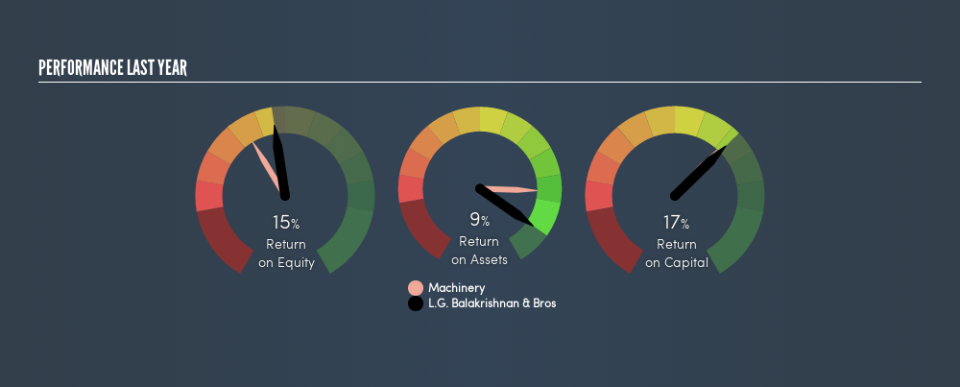
Many investors are still learning about the various metrics that can be useful when analysing a stock. This article is for those who would like to learn about Return On Equity (ROE). To keep the lesson grounded in practicality, we'll use ROE to better understand L.G. Balakrishnan & Bros Limited (NSE:LGBBROSLTD).
Over the last twelve months L.G. Balakrishnan & Bros has recorded a ROE of 15%. One way to conceptualize this, is that for each ₹1 of shareholders' equity it has, the company made ₹0.15 in profit.
Check out our latest analysis for L.G. Balakrishnan & Bros
How Do You Calculate Return On Equity?
The formula for ROE is:
Return on Equity = Net Profit ÷ Shareholders' Equity
Or for L.G. Balakrishnan & Bros:
15% = ₹996m ÷ ₹6.8b (Based on the trailing twelve months to March 2019.)
Most know that net profit is the total earnings after all expenses, but the concept of shareholders' equity is a little more complicated. It is the capital paid in by shareholders, plus any retained earnings. You can calculate shareholders' equity by subtracting the company's total liabilities from its total assets.
What Does ROE Mean?
ROE measures a company's profitability against the profit it retains, and any outside investments. The 'return' is the yearly profit. That means that the higher the ROE, the more profitable the company is. So, all else equal, investors should like a high ROE. That means ROE can be used to compare two businesses.
Does L.G. Balakrishnan & Bros Have A Good ROE?
One simple way to determine if a company has a good return on equity is to compare it to the average for its industry. Importantly, this is far from a perfect measure, because companies differ significantly within the same industry classification. As you can see in the graphic below, L.G. Balakrishnan & Bros has a higher ROE than the average (11%) in the Machinery industry.
That's what I like to see. In my book, a high ROE almost always warrants a closer look. For example you might check if insiders are buying shares.
The Importance Of Debt To Return On Equity
Most companies need money -- from somewhere -- to grow their profits. That cash can come from issuing shares, retained earnings, or debt. In the case of the first and second options, the ROE will reflect this use of cash, for growth. In the latter case, the debt used for growth will improve returns, but won't affect the total equity. Thus the use of debt can improve ROE, albeit along with extra risk in the case of stormy weather, metaphorically speaking.
L.G. Balakrishnan & Bros's Debt And Its 15% ROE
L.G. Balakrishnan & Bros has a debt to equity ratio of 0.32, which is far from excessive. I'm not impressed with its ROE, but the debt levels are not too high, indicating the business has decent prospects. Conservative use of debt to boost returns is usually a good move for shareholders, though it does leave the company more exposed to interest rate rises.
The Bottom Line On ROE
Return on equity is a useful indicator of the ability of a business to generate profits and return them to shareholders. A company that can achieve a high return on equity without debt could be considered a high quality business. All else being equal, a higher ROE is better.
But when a business is high quality, the market often bids it up to a price that reflects this. The rate at which profits are likely to grow, relative to the expectations of profit growth reflected in the current price, must be considered, too. So you might want to check this FREE visualization of analyst forecasts for the company.
Of course L.G. Balakrishnan & Bros may not be the best stock to buy. So you may wish to see this free collection of other companies that have high ROE and low debt.
We aim to bring you long-term focused research analysis driven by fundamental data. Note that our analysis may not factor in the latest price-sensitive company announcements or qualitative material.
If you spot an error that warrants correction, please contact the editor at editorial-team@simplywallst.com. This article by Simply Wall St is general in nature. It does not constitute a recommendation to buy or sell any stock, and does not take account of your objectives, or your financial situation. Simply Wall St has no position in the stocks mentioned. Thank you for reading.
