What Can We Make Of Lam Research Corporation’s (NASDAQ:LRCX) High Return On Capital?

Want to participate in a short research study? Help shape the future of investing tools and you could win a $250 gift card!
Today we'll look at Lam Research Corporation (NASDAQ:LRCX) and reflect on its potential as an investment. Specifically, we'll consider its Return On Capital Employed (ROCE), since that will give us an insight into how efficiently the business can generate profits from the capital it requires.
First, we'll go over how we calculate ROCE. Second, we'll look at its ROCE compared to similar companies. And finally, we'll look at how its current liabilities are impacting its ROCE.
Return On Capital Employed (ROCE): What is it?
ROCE measures the 'return' (pre-tax profit) a company generates from capital employed in its business. In general, businesses with a higher ROCE are usually better quality. Ultimately, it is a useful but imperfect metric. Author Edwin Whiting says to be careful when comparing the ROCE of different businesses, since 'No two businesses are exactly alike.'
So, How Do We Calculate ROCE?
Analysts use this formula to calculate return on capital employed:
Return on Capital Employed = Earnings Before Interest and Tax (EBIT) ÷ (Total Assets - Current Liabilities)
Or for Lam Research:
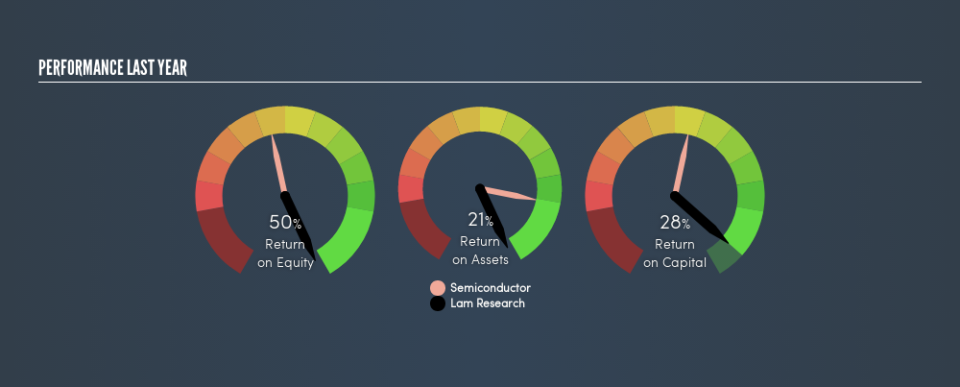
0.28 = US$2.8b ÷ (US$13b - US$2.8b) (Based on the trailing twelve months to March 2019.)
So, Lam Research has an ROCE of 28%.
See our latest analysis for Lam Research
Does Lam Research Have A Good ROCE?
ROCE can be useful when making comparisons, such as between similar companies. In our analysis, Lam Research's ROCE is meaningfully higher than the 11% average in the Semiconductor industry. I think that's good to see, since it implies the company is better than other companies at making the most of its capital. Regardless of the industry comparison, in absolute terms, Lam Research's ROCE currently appears to be excellent.
We can see that , Lam Research currently has an ROCE of 28% compared to its ROCE 3 years ago, which was 13%. This makes us wonder if the company is improving. You can click on the image below to see (in greater detail) how Lam Research's past growth compares to other companies.
When considering ROCE, bear in mind that it reflects the past and does not necessarily predict the future. ROCE can be misleading for companies in cyclical industries, with returns looking impressive during the boom times, but very weak during the busts. This is because ROCE only looks at one year, instead of considering returns across a whole cycle. Since the future is so important for investors, you should check out our free report on analyst forecasts for Lam Research.
Lam Research's Current Liabilities And Their Impact On Its ROCE
Liabilities, such as supplier bills and bank overdrafts, are referred to as current liabilities if they need to be paid within 12 months. The ROCE equation subtracts current liabilities from capital employed, so a company with a lot of current liabilities appears to have less capital employed, and a higher ROCE than otherwise. To check the impact of this, we calculate if a company has high current liabilities relative to its total assets.
Lam Research has total liabilities of US$2.8b and total assets of US$13b. Therefore its current liabilities are equivalent to approximately 22% of its total assets. This is quite a low level of current liabilities which would not greatly boost the already high ROCE.
The Bottom Line On Lam Research's ROCE
Low current liabilities and high ROCE is a good combination, making Lam Research look quite interesting. Lam Research looks strong on this analysis, but there are plenty of other companies that could be a good opportunity . Here is a free list of companies growing earnings rapidly.
If you like to buy stocks alongside management, then you might just love this free list of companies. (Hint: insiders have been buying them).
We aim to bring you long-term focused research analysis driven by fundamental data. Note that our analysis may not factor in the latest price-sensitive company announcements or qualitative material.
If you spot an error that warrants correction, please contact the editor at editorial-team@simplywallst.com. This article by Simply Wall St is general in nature. It does not constitute a recommendation to buy or sell any stock, and does not take account of your objectives, or your financial situation. Simply Wall St has no position in the stocks mentioned. Thank you for reading.
