Is Lamb Weston Holdings, Inc.'s (NYSE:LW) High P/E Ratio A Problem For Investors?

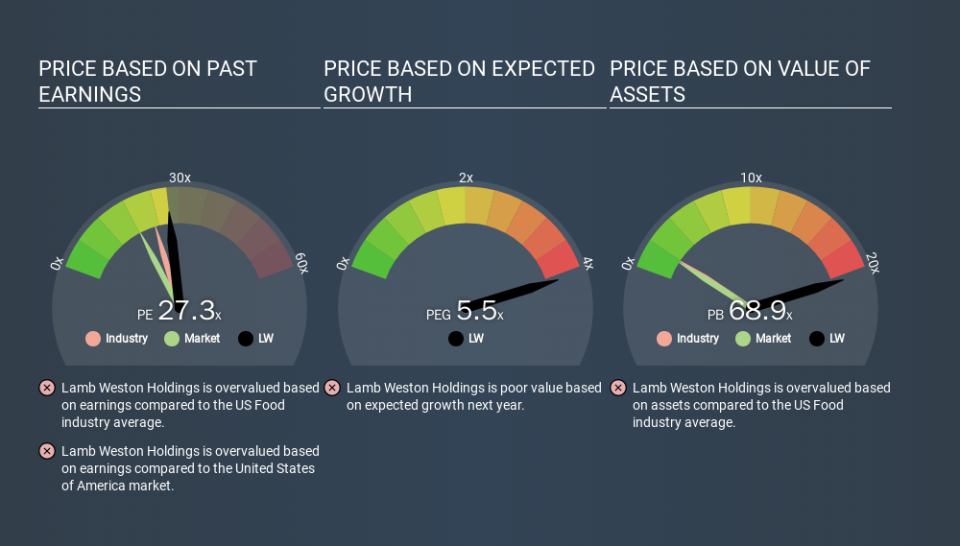
This article is written for those who want to get better at using price to earnings ratios (P/E ratios). To keep it practical, we'll show how Lamb Weston Holdings, Inc.'s (NYSE:LW) P/E ratio could help you assess the value on offer. Lamb Weston Holdings has a P/E ratio of 27.32, based on the last twelve months. That corresponds to an earnings yield of approximately 3.7%.
Check out our latest analysis for Lamb Weston Holdings
How Do I Calculate Lamb Weston Holdings's Price To Earnings Ratio?
The formula for P/E is:
Price to Earnings Ratio = Share Price ÷ Earnings per Share (EPS)
Or for Lamb Weston Holdings:
P/E of 27.32 = USD94.84 ÷ USD3.47 (Based on the trailing twelve months to November 2019.)
Is A High Price-to-Earnings Ratio Good?
A higher P/E ratio implies that investors pay a higher price for the earning power of the business. That is not a good or a bad thing per se, but a high P/E does imply buyers are optimistic about the future.
Does Lamb Weston Holdings Have A Relatively High Or Low P/E For Its Industry?
One good way to get a quick read on what market participants expect of a company is to look at its P/E ratio. As you can see below, Lamb Weston Holdings has a higher P/E than the average company (22.9) in the food industry.
That means that the market expects Lamb Weston Holdings will outperform other companies in its industry. Clearly the market expects growth, but it isn't guaranteed. So investors should always consider the P/E ratio alongside other factors, such as whether company directors have been buying shares.
How Growth Rates Impact P/E Ratios
Earnings growth rates have a big influence on P/E ratios. Earnings growth means that in the future the 'E' will be higher. That means even if the current P/E is high, it will reduce over time if the share price stays flat. A lower P/E should indicate the stock is cheap relative to others -- and that may attract buyers.
Lamb Weston Holdings saw earnings per share improve by -7.9% last year. And earnings per share have improved by 18% annually, over the last three years.
Don't Forget: The P/E Does Not Account For Debt or Bank Deposits
It's important to note that the P/E ratio considers the market capitalization, not the enterprise value. Thus, the metric does not reflect cash or debt held by the company. The exact same company would hypothetically deserve a higher P/E ratio if it had a strong balance sheet, than if it had a weak one with lots of debt, because a cashed up company can spend on growth.
Spending on growth might be good or bad a few years later, but the point is that the P/E ratio does not account for the option (or lack thereof).
How Does Lamb Weston Holdings's Debt Impact Its P/E Ratio?
Lamb Weston Holdings has net debt worth 16% of its market capitalization. That's enough debt to impact the P/E ratio a little; so keep it in mind if you're comparing it to companies without debt.
The Verdict On Lamb Weston Holdings's P/E Ratio
Lamb Weston Holdings trades on a P/E ratio of 27.3, which is above its market average of 18.2. With debt at prudent levels and improving earnings, it's fair to say the market expects steady progress in the future.
Investors have an opportunity when market expectations about a stock are wrong. People often underestimate remarkable growth -- so investors can make money when fast growth is not fully appreciated. So this free visualization of the analyst consensus on future earnings could help you make the right decision about whether to buy, sell, or hold.
Of course you might be able to find a better stock than Lamb Weston Holdings. So you may wish to see this free collection of other companies that have grown earnings strongly.
If you spot an error that warrants correction, please contact the editor at editorial-team@simplywallst.com. This article by Simply Wall St is general in nature. It does not constitute a recommendation to buy or sell any stock, and does not take account of your objectives, or your financial situation. Simply Wall St has no position in the stocks mentioned.
We aim to bring you long-term focused research analysis driven by fundamental data. Note that our analysis may not factor in the latest price-sensitive company announcements or qualitative material. Thank you for reading.
