Is LaserBond Limited's (ASX:LBL) Stock's Recent Performance Being Led By Its Attractive Financial Prospects?
Most readers would already be aware that LaserBond's (ASX:LBL) stock increased significantly by 21% over the past month. Given that the market rewards strong financials in the long-term, we wonder if that is the case in this instance. Particularly, we will be paying attention to LaserBond's ROE today.
Return on equity or ROE is an important factor to be considered by a shareholder because it tells them how effectively their capital is being reinvested. In short, ROE shows the profit each dollar generates with respect to its shareholder investments.
View our latest analysis for LaserBond
How Do You Calculate Return On Equity?
The formula for ROE is:
Return on Equity = Net Profit (from continuing operations) ÷ Shareholders' Equity
So, based on the above formula, the ROE for LaserBond is:
22% = AU$2.8m ÷ AU$13m (Based on the trailing twelve months to December 2020).
The 'return' refers to a company's earnings over the last year. That means that for every A$1 worth of shareholders' equity, the company generated A$0.22 in profit.
What Has ROE Got To Do With Earnings Growth?
Thus far, we have learned that ROE measures how efficiently a company is generating its profits. We now need to evaluate how much profit the company reinvests or "retains" for future growth which then gives us an idea about the growth potential of the company. Assuming everything else remains unchanged, the higher the ROE and profit retention, the higher the growth rate of a company compared to companies that don't necessarily bear these characteristics.
LaserBond's Earnings Growth And 22% ROE
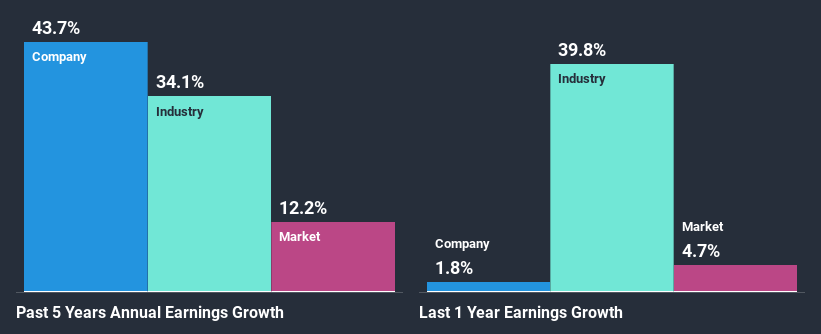
To begin with, LaserBond seems to have a respectable ROE. Further, the company's ROE compares quite favorably to the industry average of 12%. This probably laid the ground for LaserBond's significant 44% net income growth seen over the past five years. We believe that there might also be other aspects that are positively influencing the company's earnings growth. For instance, the company has a low payout ratio or is being managed efficiently.
We then compared LaserBond's net income growth with the industry and we're pleased to see that the company's growth figure is higher when compared with the industry which has a growth rate of 34% in the same period.
Earnings growth is an important metric to consider when valuing a stock. What investors need to determine next is if the expected earnings growth, or the lack of it, is already built into the share price. By doing so, they will have an idea if the stock is headed into clear blue waters or if swampy waters await. Is LaserBond fairly valued compared to other companies? These 3 valuation measures might help you decide.
Is LaserBond Efficiently Re-investing Its Profits?
The three-year median payout ratio for LaserBond is 39%, which is moderately low. The company is retaining the remaining 61%. So it seems that LaserBond is reinvesting efficiently in a way that it sees impressive growth in its earnings (discussed above) and pays a dividend that's well covered.
Moreover, LaserBond is determined to keep sharing its profits with shareholders which we infer from its long history of paying a dividend for at least ten years. Upon studying the latest analysts' consensus data, we found that the company is expected to keep paying out approximately 32% of its profits over the next three years. Therefore, the company's future ROE is also not expected to change by much with analysts predicting an ROE of 26%.
Summary
In total, we are pretty happy with LaserBond's performance. In particular, it's great to see that the company is investing heavily into its business and along with a high rate of return, that has resulted in a sizeable growth in its earnings. Having said that, the company's earnings growth is expected to slow down, as forecasted in the current analyst estimates. To know more about the latest analysts predictions for the company, check out this visualization of analyst forecasts for the company.
This article by Simply Wall St is general in nature. It does not constitute a recommendation to buy or sell any stock, and does not take account of your objectives, or your financial situation. We aim to bring you long-term focused analysis driven by fundamental data. Note that our analysis may not factor in the latest price-sensitive company announcements or qualitative material. Simply Wall St has no position in any stocks mentioned.
Have feedback on this article? Concerned about the content? Get in touch with us directly. Alternatively, email editorial-team (at) simplywallst.com.
