What Can We Learn From VERBUND AG’s (VIE:VER) Investment Returns?

Want to participate in a short research study? Help shape the future of investing tools and receive a $20 prize!
Today we are going to look at VERBUND AG (VIE:VER) to see whether it might be an attractive investment prospect. In particular, we’ll consider its Return On Capital Employed (ROCE), as that can give us insight into how profitably the company is able to employ capital in its business.
First up, we’ll look at what ROCE is and how we calculate it. Second, we’ll look at its ROCE compared to similar companies. Finally, we’ll look at how its current liabilities affect its ROCE.
Return On Capital Employed (ROCE): What is it?
ROCE measures the amount of pre-tax profits a company can generate from the capital employed in its business. In general, businesses with a higher ROCE are usually better quality. Overall, it is a valuable metric that has its flaws. Author Edwin Whiting says to be careful when comparing the ROCE of different businesses, since ‘No two businesses are exactly alike.’
So, How Do We Calculate ROCE?
The formula for calculating the return on capital employed is:
Return on Capital Employed = Earnings Before Interest and Tax (EBIT) ÷ (Total Assets – Current Liabilities)
Or for VERBUND:
0.06 = €551m ÷ (€12b – €2.0b) (Based on the trailing twelve months to September 2018.)
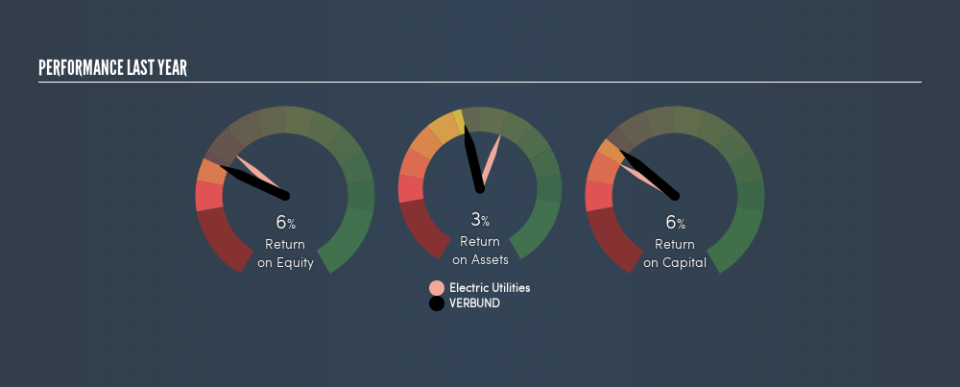
Therefore, VERBUND has an ROCE of 6.0%.
Check out our latest analysis for VERBUND
Does VERBUND Have A Good ROCE?
One way to assess ROCE is to compare similar companies. It appears that VERBUND’s ROCE is fairly close to the Electric Utilities industry average of 7.3%. Aside from the industry comparison, VERBUND’s ROCE is mediocre in absolute terms, considering the risk of investing in stocks versus the safety of a bank account. Readers may find more attractive investment prospects elsewhere.
As we can see, VERBUND currently has an ROCE of 6.0% compared to its ROCE 3 years ago, which was 4.8%. This makes us wonder if the company is improving.
When considering this metric, keep in mind that it is backwards looking, and not necessarily predictive. ROCE can be deceptive for cyclical businesses, as returns can look incredible in boom times, and terribly low in downturns. This is because ROCE only looks at one year, instead of considering returns across a whole cycle. What happens in the future is pretty important for investors, so we have prepared a free report on analyst forecasts for VERBUND.
How VERBUND’s Current Liabilities Impact Its ROCE
Liabilities, such as supplier bills and bank overdrafts, are referred to as current liabilities if they need to be paid within 12 months. Due to the way ROCE is calculated, a high level of current liabilities makes a company look as though it has less capital employed, and thus can (sometimes unfairly) boost the ROCE. To counteract this, we check if a company has high current liabilities, relative to its total assets.
VERBUND has total liabilities of €2.0b and total assets of €12b. As a result, its current liabilities are equal to approximately 17% of its total assets. This is a modest level of current liabilities, which would only have a small effect on ROCE.
The Bottom Line On VERBUND’s ROCE
With that in mind, we’re not overly impressed with VERBUND’s ROCE, so it may not be the most appealing prospect. Of course you might be able to find a better stock than VERBUND. So you may wish to see this free collection of other companies that have grown earnings strongly.
If you like to buy stocks alongside management, then you might just love this free list of companies. (Hint: insiders have been buying them).
We aim to bring you long-term focused research analysis driven by fundamental data. Note that our analysis may not factor in the latest price-sensitive company announcements or qualitative material.
If you spot an error that warrants correction, please contact the editor at editorial-team@simplywallst.com. This article by Simply Wall St is general in nature. It does not constitute a recommendation to buy or sell any stock, and does not take account of your objectives, or your financial situation. Simply Wall St has no position in the stocks mentioned. Thank you for reading.
