Can Legal & General Group Plc’s (LSE:LGEN) ROE Continue To Surpass The Industry Average?

Legal & General Group Plc (LSE:LGEN) outperformed the Life and Health Insurance industry on the basis of its ROE – producing a higher 21.46% relative to the peer average of 15.84% over the past 12 months. On the surface, this looks fantastic since we know that LGEN has made large profits from little equity capital; however, ROE doesn’t tell us if management have borrowed heavily to make this happen. Today, we’ll take a closer look at some factors like financial leverage to see how sustainable LGEN’s ROE is. View our latest analysis for Legal & General Group
Breaking down ROE — the mother of all ratios
Return on Equity (ROE) is a measure of LGEN’s profit relative to its shareholders’ equity. An ROE of 21.46% implies £0.21 returned on every £1 invested. In most cases, a higher ROE is preferred; however, there are many other factors we must consider prior to making any investment decisions.
Return on Equity = Net Profit ÷ Shareholders Equity
Returns are usually compared to costs to measure the efficiency of capital. LGEN’s cost of equity is 8.30%. This means LGEN returns enough to cover its own cost of equity, with a buffer of 13.16%. This sustainable practice implies that the company pays less for its capital than what it generates in return. ROE can be broken down into three different ratios: net profit margin, asset turnover, and financial leverage. This is called the Dupont Formula:
Dupont Formula
ROE = profit margin × asset turnover × financial leverage
ROE = (annual net profit ÷ sales) × (sales ÷ assets) × (assets ÷ shareholders’ equity)
ROE = annual net profit ÷ shareholders’ equity
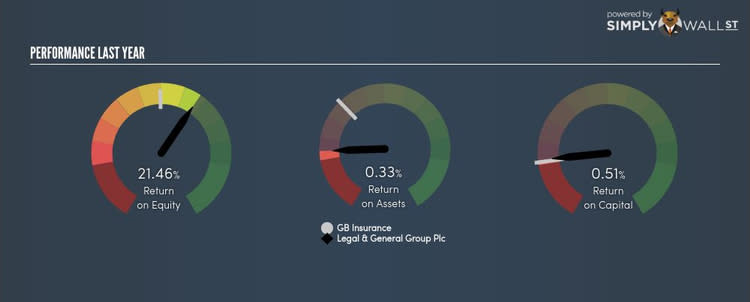
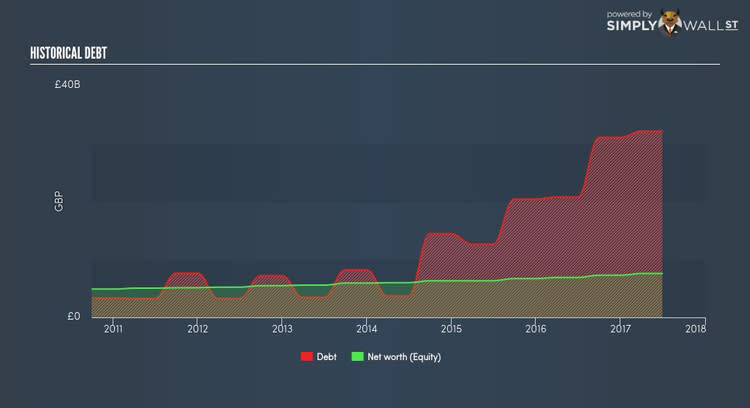
The first component is profit margin, which measures how much of sales is retained after the company pays for all its expenses. The other component, asset turnover, illustrates how much revenue LGEN can make from its asset base. And finally, financial leverage is simply how much of assets are funded by equity, which exhibits how sustainable LGEN’s capital structure is. Since ROE can be inflated by excessive debt, we need to examine LGEN’s debt-to-equity level. At over 2.5 times, LGEN’s debt-to-equity ratio is very high and indicates the above-average ROE is generated by significant leverage levels.
What this means for you:
Are you a shareholder? LGEN’s above-industry ROE is encouraging, and is also in excess of its cost of equity. However, its high debt level appears to be the driver of a strong ROE and is something you should be mindful of before adding more of LGEN to your portfolio.
Are you a potential investor? If you are considering investing in LGEN, basing your decision on ROE alone is certainly not sufficient. I recommend you do additional fundamental analysis by looking through our most recent infographic report on Legal & General Group to help you make a more informed investment decision. If you are not interested in LGEN anymore, you can use our free platform to see our list of stocks with Return on Equity over 20%.
To help readers see pass the short term volatility of the financial market, we aim to bring you a long-term focused research analysis purely driven by fundamental data. Note that our analysis does not factor in the latest price sensitive company announcements.
The author is an independent contributor and at the time of publication had no position in the stocks mentioned.
