Do You Like Legend Corporation Limited (ASX:LGD) At This P/E Ratio?

Want to participate in a research study? Help shape the future of investing tools and earn a $60 gift card!
This article is for investors who would like to improve their understanding of price to earnings ratios (P/E ratios). We'll look at Legend Corporation Limited's (ASX:LGD) P/E ratio and reflect on what it tells us about the company's share price. Legend has a P/E ratio of 8.86, based on the last twelve months. That is equivalent to an earnings yield of about 11%.
Check out our latest analysis for Legend
How Do You Calculate A P/E Ratio?
The formula for P/E is:
Price to Earnings Ratio = Share Price ÷ Earnings per Share (EPS)
Or for Legend:
P/E of 8.86 = A$0.30 ÷ A$0.034 (Based on the trailing twelve months to December 2018.)
Is A High P/E Ratio Good?
A higher P/E ratio means that buyers have to pay a higher price for each A$1 the company has earned over the last year. That is not a good or a bad thing per se, but a high P/E does imply buyers are optimistic about the future.
How Growth Rates Impact P/E Ratios
P/E ratios primarily reflect market expectations around earnings growth rates. Earnings growth means that in the future the 'E' will be higher. That means unless the share price increases, the P/E will reduce in a few years. A lower P/E should indicate the stock is cheap relative to others -- and that may attract buyers.
Legend increased earnings per share by a whopping 34% last year. And its annual EPS growth rate over 3 years is 11%. I'd therefore be a little surprised if its P/E ratio was not relatively high. Unfortunately, earnings per share are down 5.2% a year, over 5 years.
How Does Legend's P/E Ratio Compare To Its Peers?
We can get an indication of market expectations by looking at the P/E ratio. If you look at the image below, you can see Legend has a lower P/E than the average (18.2) in the trade distributors industry classification.
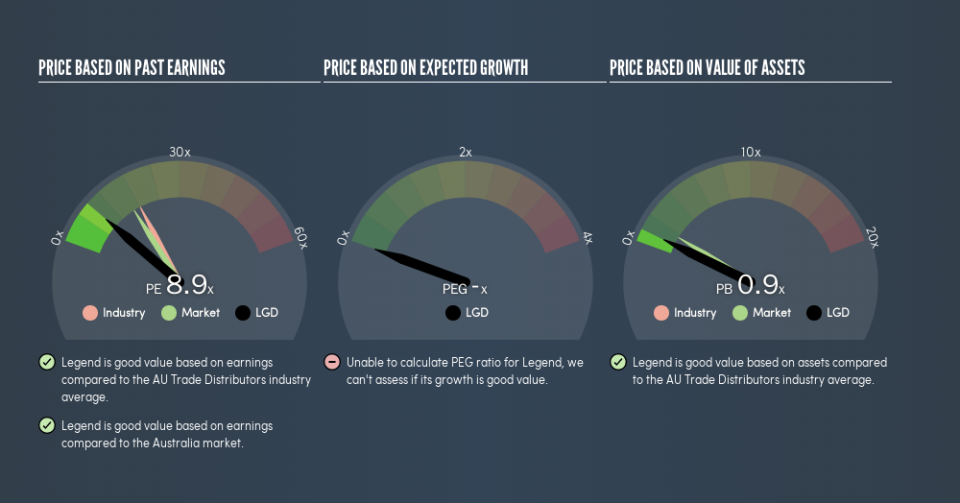
Its relatively low P/E ratio indicates that Legend shareholders think it will struggle to do as well as other companies in its industry classification. Many investors like to buy stocks when the market is pessimistic about their prospects. It is arguably worth checking if insiders are buying shares, because that might imply they believe the stock is undervalued.
A Limitation: P/E Ratios Ignore Debt and Cash In The Bank
Don't forget that the P/E ratio considers market capitalization. Thus, the metric does not reflect cash or debt held by the company. In theory, a company can lower its future P/E ratio by using cash or debt to invest in growth.
Spending on growth might be good or bad a few years later, but the point is that the P/E ratio does not account for the option (or lack thereof).
How Does Legend's Debt Impact Its P/E Ratio?
Net debt totals 31% of Legend's market cap. This is enough debt that you'd have to make some adjustments before using the P/E ratio to compare it to a company with net cash.
The Verdict On Legend's P/E Ratio
Legend has a P/E of 8.9. That's below the average in the AU market, which is 16.2. The company hasn't stretched its balance sheet, and earnings growth was good last year. If it continues to grow, then the current low P/E may prove to be unjustified.
Investors should be looking to buy stocks that the market is wrong about. As value investor Benjamin Graham famously said, 'In the short run, the market is a voting machine but in the long run, it is a weighing machine.' Although we don't have analyst forecasts, you might want to assess this data-rich visualization of earnings, revenue and cash flow.
You might be able to find a better buy than Legend. If you want a selection of possible winners, check out this free list of interesting companies that trade on a P/E below 20 (but have proven they can grow earnings).
We aim to bring you long-term focused research analysis driven by fundamental data. Note that our analysis may not factor in the latest price-sensitive company announcements or qualitative material.
If you spot an error that warrants correction, please contact the editor at editorial-team@simplywallst.com. This article by Simply Wall St is general in nature. It does not constitute a recommendation to buy or sell any stock, and does not take account of your objectives, or your financial situation. Simply Wall St has no position in the stocks mentioned. Thank you for reading.
