Do You Like Leoch International Technology Limited (HKG:842) At This P/E Ratio?

The goal of this article is to teach you how to use price to earnings ratios (P/E ratios). To keep it practical, we’ll show how Leoch International Technology Limited’s (HKG:842) P/E ratio could help you assess the value on offer. Leoch International Technology has a price to earnings ratio of 3.38, based on the last twelve months. That is equivalent to an earnings yield of about 30%.
Check out our latest analysis for Leoch International Technology
How Do I Calculate A Price To Earnings Ratio?
The formula for P/E is:
Price to Earnings Ratio = Share Price (in reporting currency) ÷ Earnings per Share (EPS)
Or for Leoch International Technology:
P/E of 3.38 = CN¥0.55 (Note: this is the share price in the reporting currency, namely, CNY ) ÷ CN¥0.16 (Based on the trailing twelve months to June 2018.)
Is A High Price-to-Earnings Ratio Good?
A higher P/E ratio means that investors are paying a higher price for each HK$1 of company earnings. That isn’t a good or a bad thing on its own, but a high P/E means that buyers have a higher opinion of the business’s prospects, relative to stocks with a lower P/E.
How Growth Rates Impact P/E Ratios
Earnings growth rates have a big influence on P/E ratios. When earnings grow, the ‘E’ increases, over time. That means unless the share price increases, the P/E will reduce in a few years. So while a stock may look expensive based on past earnings, it could be cheap based on future earnings.
Leoch International Technology shrunk earnings per share by 1.3% last year. But it has grown its earnings per share by 49% per year over the last five years.
How Does Leoch International Technology’s P/E Ratio Compare To Its Peers?
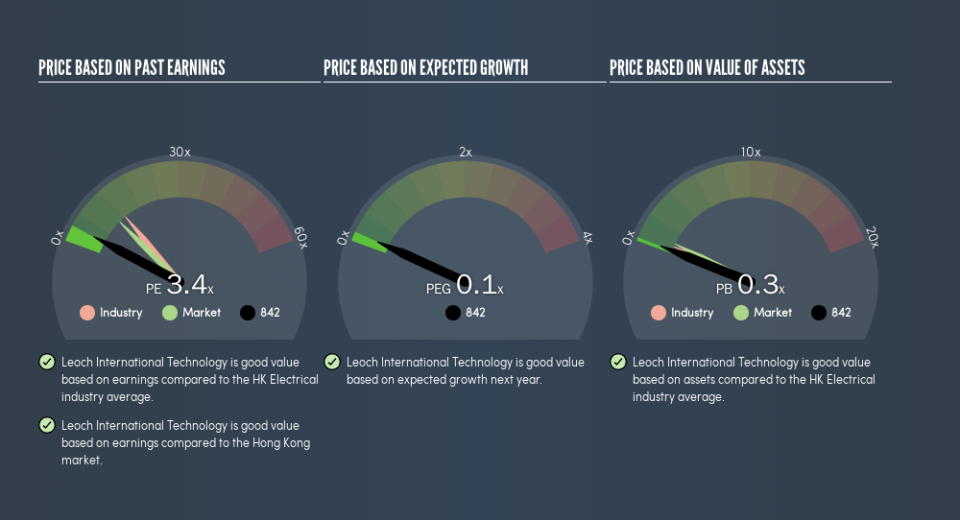
The P/E ratio indicates whether the market has higher or lower expectations of a company. If you look at the image below, you can see Leoch International Technology has a lower P/E than the average (13) in the electrical industry classification.
This suggests that market participants think Leoch International Technology will underperform other companies in its industry. While current expectations are low, the stock could be undervalued if the situation is better than the market assumes. If you consider the stock interesting, further research is recommended. For example, I often monitor director buying and selling.
Don’t Forget: The P/E Does Not Account For Debt or Bank Deposits
It’s important to note that the P/E ratio considers the market capitalization, not the enterprise value. Thus, the metric does not reflect cash or debt held by the company. Hypothetically, a company could reduce its future P/E ratio by spending its cash (or taking on debt) to achieve higher earnings.
Such spending might be good or bad, overall, but the key point here is that you need to look at debt to understand the P/E ratio in context.
Leoch International Technology’s Balance Sheet
Net debt totals a substantial 334% of Leoch International Technology’s market cap. This is a relatively high level of debt, so the stock probably deserves a relatively low P/E ratio. Keep that in mind when comparing it to other companies.
The Bottom Line On Leoch International Technology’s P/E Ratio
Leoch International Technology trades on a P/E ratio of 3.4, which is below the HK market average of 10.7. The P/E reflects market pessimism that probably arises from the lack of recent EPS growth, paired with significant leverage.
When the market is wrong about a stock, it gives savvy investors an opportunity. As value investor Benjamin Graham famously said, ‘In the short run, the market is a voting machine but in the long run, it is a weighing machine.’ So this free visualization of the analyst consensus on future earnings could help you make the right decision about whether to buy, sell, or hold.
You might be able to find a better buy than Leoch International Technology. If you want a selection of possible winners, check out this free list of interesting companies that trade on a P/E below 20 (but have proven they can grow earnings).
We aim to bring you long-term focused research analysis driven by fundamental data. Note that our analysis may not factor in the latest price-sensitive company announcements or qualitative material.
If you spot an error that warrants correction, please contact the editor at editorial-team@simplywallst.com. This article by Simply Wall St is general in nature. It does not constitute a recommendation to buy or sell any stock, and does not take account of your objectives, or your financial situation. Simply Wall St has no position in the stocks mentioned. Thank you for reading.
