Long US Dollar AND Stocks are both Crowded…and Both at Risk
June is historically the worst month for the stock market. Judging by the last few hours of trading, June apparently came early. A bigger stock market setback probably occurs coincident with a decline in the US Dollar. Why? Long USD and long stocks are both crowded trades. In times of panic, crowded trades get destroyed.
USDOLLAR
Daily

Chart Prepared by Jamie Saettele, CMT using Marketscope 2.0
Are you new to FX or curious about your trading IQ?
FOREXAnalysis: USDOLLAR technicals have pointed us in the right direction of late. Entering May, we were looking for a broad based USD rally to complete 5 waves up from the September low. The reversal off of the Elliott channel (2 reversals actually…5/23 and 5/29) now warns of lower prices in the weeks ahead. How low? I don’t know but I do know that estimated support is 10655 and 10597. Of interest as well is the top side of the former resistance line that extends off of the 2011 and 2012 highs, and of course channel support that defines the advance from the September low.
FOREX Trading Strategy: Looking for a low between 10597 and 10655…the lower and quicker we get there the better. A fast ‘panicky’ decline, preferably closer to 10597, might be enough to ‘reset’ the market for the next leg higher.
USDJPY
Daily

Chart Prepared by Jamie Saettele, CMT using Marketscope 2.0
Are you new to FX or curious about your trading IQ?
FOREXAnalysis: The USDJPY rally from 90.84 is an ending diagonal (wedge). Such patterns are usually resolved violently and often fully retraced. Last week’s outside reversal week on a slightly less than record week of volume (CME volume was slightly less than the week that ended 8/17/07) is consistent with an important top. After a pop into 102.50, the USDJPY closed the week lower which qualifies as follow through on the reversal. It’s a good sign for bears that price has separated a bit from the 5/23 close (large range and volume day) of 101.97. Large range and volume days are valuable as pivots (below is bearish and above is bullish). A trendline that extends off of the November 2012 and April 2013 lows is at about 98.40 on Monday and increases about 10 pips per day. The 5/8 low at 98.57 reinforces the area as one of interest. This could be the first support (minor) in a much needed decline. 96.70-97.40 is probably stronger if reached.
FOREX Trading Strategy: Bearish below 102.00 towards 98.50 and 97.00.
AUDUSD
Daily
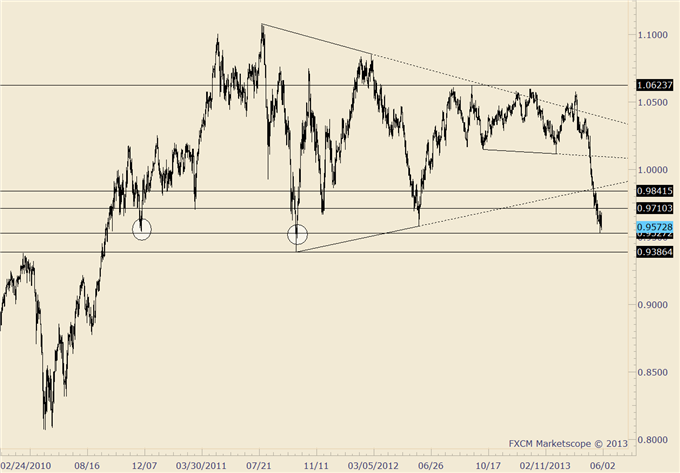
Chart Prepared by Jamie Saettele, CMT using Marketscope 2.0
Are you new to FX or curious about your trading IQ?
FOREXAnalysis: The AUDUSD traded to its lowest level since 10/4/2011 on Wednesday before reversing sharply. A long legged key reversal at an important level (the long held AUDUSD target of .9605 has been reached but has never been closed below) after a brutal decline is consistent with at least a near term low. From an Elliott perspective, a rally would probably compose a 4th wave and could carry back to .9841 before the next top forms. The circled area on the chart highlights the December 2010 low and day of the October 2011 low.
FOREXTrading Strategy: Above .9700 is needed in order to trade on the long side into .9840. I’m looking for resistance into .9840/80. The underside of the line that extends off of the 2011 and 2012 lows is at about .9880 next week.
GBPUSD
Daily
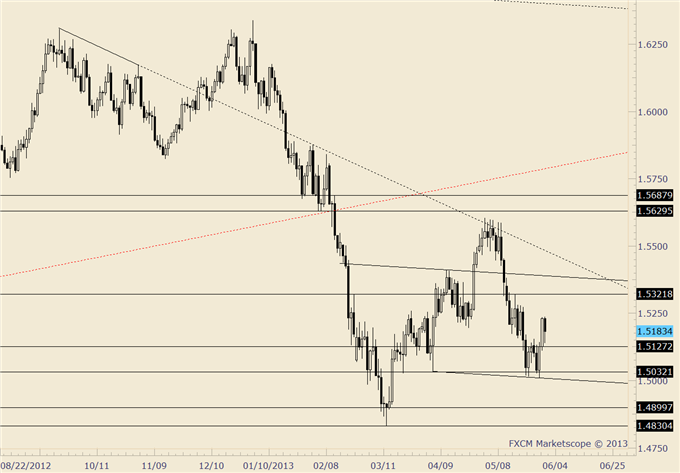
Chart Prepared by Jamie Saettele, CMT using Marketscope 2.0
Are you new to FX or curious about your trading IQ?
FOREXAnalysis: 5 waves are evident from the May GBPUSD high. The implications are for a correction of that decline before the next bear leg. The most likely stopping point for the advance is 1.5322/77 (former 4th wave and 61.8% retracement). Near term support is 1.5127.
FOREXTrading Strategy: Evidence (outside day reversal at an important level and a mature wave pattern) suggests we look higher but probably into a top that will be sold in to. Support is estimated at 1.5127 and resistance at 1.5322/77. Breakout systems will be of use after this next advance.
--- Written by Jamie Saettele, CMT, Senior Technical Strategist for DailyFX.com
To contact Jamie e-mail jsaettele@dailyfx.com. Follow him on Twitter @JamieSaettele
Subscribe to Jamie Saettele's distribution list in order to receive actionable FX trading strategy delivered to your inbox.
Jamie is the author of Sentiment in the Forex Market.
DailyFX provides forex news and technical analysis on the trends that influence the global currency markets.
Learn forex trading with a free practice account and trading charts from FXCM.
