A Look At FB Financial's (NYSE:FBK) Share Price Returns
It is doubtless a positive to see that the FB Financial Corporation (NYSE:FBK) share price has gained some 38% in the last three months. But that doesn't help the fact that the three year return is less impressive. After all, the share price is down 17% in the last three years, significantly under-performing the market.
See our latest analysis for FB Financial
While markets are a powerful pricing mechanism, share prices reflect investor sentiment, not just underlying business performance. By comparing earnings per share (EPS) and share price changes over time, we can get a feel for how investor attitudes to a company have morphed over time.
During the three years that the share price fell, FB Financial's earnings per share (EPS) dropped by 8.2% each year. This fall in the EPS is worse than the 6% compound annual share price fall. So, despite the prior disappointment, shareholders must have some confidence the situation will improve, longer term.
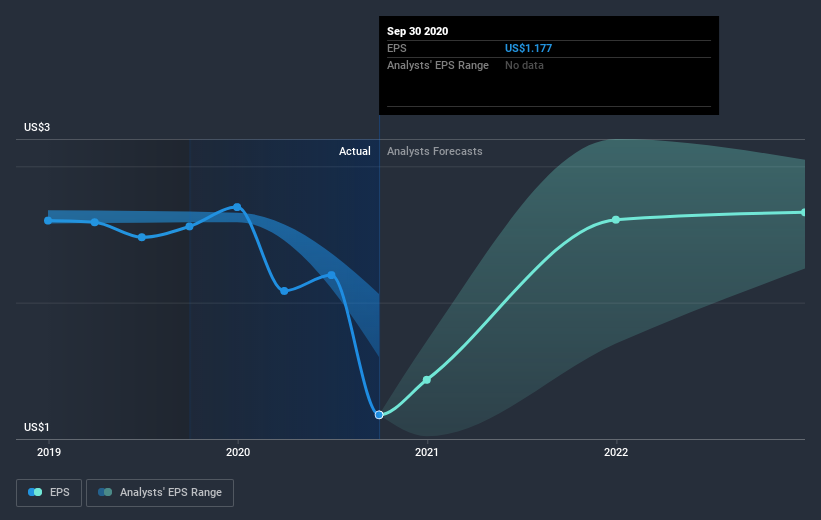
The company's earnings per share (over time) is depicted in the image below (click to see the exact numbers).
We consider it positive that insiders have made significant purchases in the last year. Even so, future earnings will be far more important to whether current shareholders make money. This free interactive report on FB Financial's earnings, revenue and cash flow is a great place to start, if you want to investigate the stock further.
What About Dividends?
It is important to consider the total shareholder return, as well as the share price return, for any given stock. Whereas the share price return only reflects the change in the share price, the TSR includes the value of dividends (assuming they were reinvested) and the benefit of any discounted capital raising or spin-off. So for companies that pay a generous dividend, the TSR is often a lot higher than the share price return. As it happens, FB Financial's TSR for the last 3 years was -15%, which exceeds the share price return mentioned earlier. This is largely a result of its dividend payments!
A Different Perspective
FB Financial shareholders are down 11% for the year, (even including dividends), but the broader market is up 23%. Of course the long term matters more than the short term, and even great stocks will sometimes have a poor year. The three-year loss of 5% per year isn't as bad as the last twelve months, suggesting that the company has not been able to convince the market it has solved its problems. We would be wary of buying into a company with unsolved problems, although some investors will buy into struggling stocks if they believe the price is sufficiently attractive. I find it very interesting to look at share price over the long term as a proxy for business performance. But to truly gain insight, we need to consider other information, too. For instance, we've identified 5 warning signs for FB Financial (1 is a bit unpleasant) that you should be aware of.
There are plenty of other companies that have insiders buying up shares. You probably do not want to miss this free list of growing companies that insiders are buying.
Please note, the market returns quoted in this article reflect the market weighted average returns of stocks that currently trade on US exchanges.
This article by Simply Wall St is general in nature. It does not constitute a recommendation to buy or sell any stock, and does not take account of your objectives, or your financial situation. We aim to bring you long-term focused analysis driven by fundamental data. Note that our analysis may not factor in the latest price-sensitive company announcements or qualitative material. Simply Wall St has no position in any stocks mentioned.
Have feedback on this article? Concerned about the content? Get in touch with us directly. Alternatively, email editorial-team (at) simplywallst.com.
