Mackinac Financial Corporation Reports 2020 Third Quarter Results and COVID-19 Operating Update
Overall Quarterly Loan Production
Overall Quarterly Loan Production
COVID-19 Commercial Loan Modifications Remaining on Interest Only

COVID-19 Commercial Loan Modifications Remaining on Interest Only
Margin Analysis Per Quarter
Margin Analysis Per Quarter
MANISTIQUE, Mich., Oct. 29, 2020 (GLOBE NEWSWIRE) -- Mackinac Financial Corporation (Nasdaq: MFNC) (“we”, or the “Corporation”) the bank holding company for mBank (“the Bank”) today announced 2020 third quarter net income of $3.32 million, or $.32 per share, compared to 2019 third quarter net income of $3.72 million, or $.35 per share. Net income for the first three quarters of 2020 was $9.83 million, or $.93 per share, compared to $10.56 million, or $.98 per share for the same period of 2019.
Total assets of the Corporation at September 30, 2020 were $1.52 billion, compared to $1.36 billion at September 30, 2019. Shareholders’ equity at September 30, 2020 totaled $166.17 million, compared to $160.17 million at September 30, 2019. Book value per share outstanding equated to $15.78 at the end of the third quarter 2020, compared to $14.91 per share outstanding a year ago. Tangible book value at quarter-end was $142.05 million, or $13.49 per share outstanding, compared to $135.38 million, or $12.60 per share outstanding at the end of the third quarter 2019.
Additional notes:
mBank, the Corporation’s primary asset, recorded net income of $3.70 million for the third quarter of 2020 and $10.98 million for the first nine months of 2020.
COVID-19 loan modifications reside at a nominal $30.2 million, or 3.1% of total loans with no commercial loans remaining in total payment deferral at September 30, 2020, down from peak levels of $201 million in the spring.
Core bank deposit growth has been very strong this year with an increase of approximately $175 million, or 17%, year-over-year. The vast majority of that growth has centered in transactional related accounts through our branch network outreach, and treasury management line of business.
Non-interest income was very solid for the third quarter, including strong secondary market mortgage fee income and gain on sale of $1.97 million and premiums on the sale of Small Business Administration (SBA) guaranteed loans of $477 thousand. Year-to-date secondary market mortgage fees are $4.02 million and SBA premiums $1.46 million. The residential mortgage pipeline resides at very robust levels and we expect sustained output from this line of business as we look to upcoming quarters.
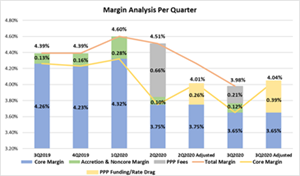
Reported margin in the third quarter, which is inclusive of accretion from acquired loans that were subject to purchase accounting adjustments and some recognition of PPP loan origination fees, was 3.98%. Estimated core operating margin when adjusting for purchase accounting accretion and PPP impact is approximately 4.04%.
COVID-19 Operating Update
As we have reported in the past, upon the onset of the COVID-19 pandemic, management took proactive measures and moved quickly to implement protocols and adjust operations to continue to serve all constituencies. These protocols have been refined throughout the second and third quarters as the pandemic operating environment evolved within the Corporation’s respective regions. Speaking to these ongoing operational activities, President of the Corporation and President and CEO of mBank, Kelly W. George, stated, “Most of our branch lobbies reopened to the public in the second quarter and operated under enhanced safety and cleaning protocols. However, as schools went back into session in early September, we made a strategic decision to proactively return to restricted lobby access via appointment only as we felt it would promote the safest possible work environment while still servicing all of our clients through our other channels, as was the case at the onset of the pandemic. Unfortunately, though still comparatively less than much of the U.S., we have seen an uptick in COVID-19 cases in some of our northern markets with the reopening of schools. However, the uptick in cases this fall has not stunted commerce activity in many of our northern markets and they continue to have strong tourism inflows and revenues longer into the fall than usual coming off a very busy summer. The southern part of our franchise remains stable, but given the lack of air travel and other larger gathering events, its recovery continues to be more muted than those clients in the north.”
Revenue & PPP Recognition
Total revenue of the Corporation for third quarter 2020 was $17.80 million, compared to $17.91 million for the third quarter of 2019. Total interest income for the third quarter was $14.69 million, compared to $16.03 million for the same period in 2019. The 2020 third quarter interest income included accretive yield of $420 thousand from combined credit mark accretion associated with acquisitions, compared to $404 thousand in the same period of 2019.
The third quarter 2020 interest income was also positively impacted by the recognition of a portion of the PPP loan origination fees that were deferred in accordance with the following required accounting treatment:
The Bank originated approximately $152 million of PPP loans in 2020.
The origination efforts resulted in fees earned of $5.09 million, which were deferred and initially recognized over the life of the PPP loans, which is 24 months.
Fee income of $2.13 million was recognized in the second quarter. This revenue was recognized per GAAP to offset $1.7 million of direct origination costs and accrete $425 thousand of the deferred fees.
There were remaining deferred fees of $2.97 million to start the third quarter.
Approximately $700 thousand of the fees were recognized in the third quarter.
Remaining earned but not recognized fees at September 30, 2020 were approximately $2.3 million which will be amortized over the remaining 18-months of the loan terms (approximately $130 thousand per month) or accelerated upon forgiveness of the loans by the Small Business Administration (“SBA”).
Loan Production and Portfolio Mix
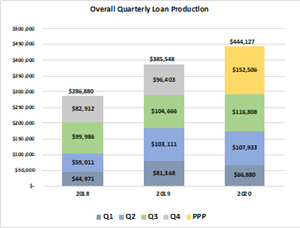
Total balance sheet loans at September 30, 2020 were $1.14 billion, which is inclusive of $152.51 million of PPP loans, compared to September 30, 2019 balances of $1.06 billion. Total loans under management reside at $1.42 billion, which includes $270.32 million of service retained loans. Driven by strong consumer mortgage activity, overall traditional loan production (non-PPP) for the first nine months of 2020 was $291.62 million, compared to $289.16 million for the same period of 2019. When including PPP loans, total production was $444.13 million. Of the total production, traditional commercial loans equated to $93 million, consumer $199 million and the aforementioned $152 million of PPP. Within the consumer totals was $155 million of secondary market mortgage production.
Overall Quarterly Loan Production is available at https://www.globenewswire.com/NewsRoom/AttachmentNg/35d1c4b9-014e-469e-8584-138432c19603
New Loan Production (excluding PPP) | ||||||||||||
Q1 | Q2 | Q3 | 2020 | |||||||||
Upper Peninsula | $ | 34,104 | $ | 44,721 | $ | 50,690 | $ | 129,515 | ||||
Northern Lower Peninsula | 17,261 | 46,490 | 42,058 | 105,809 | ||||||||
Southeast Michigan | 3,834 | 2,580 | 3,565 | 9,979 | ||||||||
Wisconsin | 11,681 | 14,142 | 15,995 | 41,818 | ||||||||
Asset-Based Lending | - | - | 4,500 | 4,500 | ||||||||
Total | $ | 66,880 | $ | 107,933 | $ | 116,808 | $ | 291,621 | ||||
Commenting on new loan production and overall lending activities, Mr. George stated, “As can be seen from our production totals, we had a very busy third quarter, which was dominated by record mortgage production. We continue to see very good mortgage activity early in the fourth quarter, given the elongated low market offering rates for refinance activity and the high demand for properties in the UP and the Northern part of our franchise as people continue to look for more space and with remote work becoming more of a permanent part of the business culture given the pandemic. As with the rest of the industry, traditional commercial lending activities have remained slower than normal, but we are seeing a gradual increase in new client requests. We continue to have a nice flow of SBA deals that have allowed us to exceed prior year income levels on the sale of the guaranteed portion of these loans thus far in 2020 and expect this focus to continue into 2021. The PPP forgiveness process remains cumbersome, though some relief was provided with a more streamlined approach for those loans less than $50,000, which impacts about 690 of our clients, or about 60% of our remaining outstanding PPP loans.”
Credit Quality and COVID-19 Loan Activity
Nonperforming loans totaled $5.41 million, or .47% (.55% excluding PPP balances) of total loans at September 30, 2020, compared to .46% of total loans at September 30, 2019. The nonperforming assets to total assets ratio resided at .48% (.53% excluding PPP balances) for the third quarter of 2020, compared to .55% for the third quarter of 2019. Total loan delinquencies greater than 30 days resided at 1.41% (1.63% excluding PPP balances), compared to .84% in 2019. The increase in delinquencies is tied to the maturity of a large participation loan where the lead bank was still finalizing the negotiations for an extension renewal that was not consummated by quarter end. Delinquencies would have been .56% (.64% excluding PPP balances) when omitting this single loan. COVID-19 related loan modification activity has continued its positive trend down throughout the third quarter. Currently only $30.2 million of loan balances ($27.6 million of commercial and $2.6 million of consumer) remain in some form of modification relief and we expect this downward trajectory to continue.
COVID-19 Loan Modifications Remaining in Deferral | |||||||
(dollars in millions) | |||||||
Covid-19 Loans in Deferral | Bank Total Loans | Remaining Deferrals to Total Loans Ratio | |||||
mBank CML Loans (interest only) | $ | 27.6 | $ | 737.7 | 3.74 | % | |
mBank CML Loans (deferral) | $ | - | $ | - | 0.00 | % | |
mBank Consumer Loans (deferral) | $ | 2.6 | $ | 239.9 | 1.10 | % | |
Total Loans | $ | 30.2 | $ | 977.6 | 3.09 | % | |
Below is an industry breakdown as a percentage of total loans of the remaining $27.6 million of COVID-19 commercial loan modifications currently in their interest only period highlighting “high impact” sectors of hotel/ tourism, retail sales and restaurant / drinking establishments. The higher risk industry credits total approximately $10.9 million and include:
Hotel: $8.08 million or .82% of total loans.
Retail: $2.43 million or .24% of total loans.
Restaurant/ drinking establishments: $416 thousand or .04% of loans.
COVID-19 Commercial Loan Modifications Remaining on Interest Only is available at https://www.globenewswire.com/NewsRoom/AttachmentNg/de109c34-6bfd-4e40-9b86-e5055966b58d
The third quarter provision for loan losses was $400 thousand. This amount was slightly increased from last quarter as a precaution given COVID-19 conditions generally, but was not due to any increase in loan loss activity or an increased risk identified within the portfolio quarter-over-quarter. The resulting Allowance for Loan Loss (“ALLL”) coverage ratio was .51% of total loans. However, the total coverage ratio (equivalent to ALLL plus remaining purchase accounting credit marks to total loans less PPP balances) is 1.04%. Management will actively refine the provision and loan reserves as client impact and broader economic data from the pandemic become more clear. The Corporation is not currently required to utilize CECL.
Commenting on overall credit risk, Mr. George stated, “The credit book has seen no signs of any systemic adverse trends and all of our COVID-19 full payment deferments for commercial loans are now expired with the remaining modifications being interest only accommodations. A very small segment of consumer loans remain in deferment as we continue to work with retail clients who have been adversely impacted for an elongated period of time within the pandemic. While certainly not clear of all headwinds, we remain cautiously optimistic in terms of overall credit performance, given further national stimulus actions are probable, and expect more clarity to evolve as to the virus spread and containment efforts. We remain ever vigilant in terms of monitoring deterioration in any isolated specific situations that could arise for a client or two where provisions could be needed in light of ongoing pandemic conditions within a particular industry that we all know can still change quickly.”
Margin Analysis, Funding and Liquidity
Net interest income for third quarter 2020 was $13.05 million, resulting in a Net Interest Margin (NIM) of 3.98%, compared to $13.32 million in the third quarter 2019 and a NIM of 4.39%. Core operating margin, which is net of accretion from acquired loans that were subject to purchase accounting adjustments and recognized PPP fee income, was 3.65% for the third quarter of 2020, compared to 4.39% for the same period of 2019. Items impacting margin, outside of the overall current low interest rate environment, include higher than normal cash balances as well as negative impact from the yields associated with PPP loans. On a non-GAAP basis, management currently estimates the direct negative impact of the PPP loan balances for the third quarter to be .39%. Estimated adjusted core margin for the third quarter is 4.04%.
Margin Analysis Per Quarter is available at https://www.globenewswire.com/NewsRoom/AttachmentNg/0ebbf7fd-4425-46ee-a2b7-20e1b905590f
Total bank deposits (excluding brokered deposits) have increased by $175.64 million year-over-year from $1.04 billion at September 30, 2019 to $1.21 billion at third quarter-end 2020. Total brokered deposits have also decreased and were $70.17 million at September 30, 2020, compared to $78.50 million at September 30, 2019, a decrease of 10%. The Corporation will also retire an additional $25 million of brokered deposits in the fourth quarter of 2020. FHLB (Federal Home Loan Bank) borrowings have also decreased roughly 10% year-over-year from $70.1 million to $63.5 million with further maturities expected to be paid off in both the first and second quarters of 2021. The Corporation utilized the Payroll Protection Program Liquidity Facility (PPPLF) to fund a portion of the PPP loan originations but has no balance on this facility as of September 30, 2020. Overall access to short-term functional liquidity remains very strong through multiple sources.
Mr. George stated, “We are very pleased with our organic efforts in terms of 17% core deposit growth this year within the more challenging pandemic environment. This is also reflective on the strong commerce activity many of our retail and tourism related clients had over the summer and into the fall and the cash buildup. We had also put some conservative measures in place at the onset of the pandemic to ensure funds availability given the large unknowns, but those wholesale funding sources were short-term in nature and have since been repaid in full. Like many banks, we remain flush with liquidity with stunted commercial loan demand given the pandemic and limited prudent investment opportunities in light of market rates, both of which have continued to compress our margin.”
Noninterest Income / Expense
Third quarter 2020 noninterest income was $3.12 million, compared to $1.88 million for the same period of 2019. The significant year-over-year improvement is mainly a combination of the secondary market mortgage and SBA sales. The SBA 7A sales were not inclusive of any PPP loan fees, all of which are recognized through interest income. Noninterest expense for the third quarter of 2020 was $11.56 million, compared to $10.44 million for the same period of 2019. Specific items associated with COVID-19 equated to $81 thousand relating to compensation for retail centric employees. As Management expected, expenses (excluding the COVID-19 related expenses) normalized in the third quarter to $11.48 million.
Assets and Capital
Total assets of the Corporation at September 30, 2020 were $1.52 billion, compared to $1.36 billion at September 30, 2019. Shareholders’ equity at September 30, 2020 totaled $166.17 million, compared to $160.17 million at September 30, 2019. Book value per share outstanding equated to $15.78 at the end of the third quarter 2020, compared to $14.91 per share outstanding a year ago. Tangible book value at quarter-end was $142.05 million, or $13.49 per share outstanding, compared to $135.38 million, or $12.60 per share outstanding at the end of the third quarter 2019.
Both the Corporation and the Bank are “well-capitalized” with total risk-based capital to risk-weighted assets of 14.49% at the Corporation and 14.16% at the Bank and tier 1 capital to total tier 1 average assets (the “leverage ratio”) at the Corporation of 9.20% and at the Bank of 9.00%. The leverage ratio is calculated inclusive of PPP loan balances. The Corporation is monitoring the impact of the recent pandemic-associated market volatility on its Goodwill asset. The Corporation continues to conduct Goodwill impairment analysis to confirm the value of this intangible asset as market events unfold.
Paul D. Tobias, Chairman and Chief Executive Officer of the Corporation and Chairman of mBank concluded, “Even with the continued impact of COVID-19 on our economy and the likely challenges ahead for all banking institutions, we remain very optimistic about the future of the company and our ability to create value for our shareholders. In the face of some pretty significant economic headwinds thus far in 2020, we have been able to maintain solid earnings while adjusting to a new working environment and continuing to meet the needs of our valued clients. While we are anxious to get back to a normal operating environment, we are committed to doing whatever is necessary to protect the safety of our employees and clients as we work through the pandemic.”
Mackinac Financial Corporation is a registered bank holding company formed under the Bank Holding Company Act of 1956 with assets in excess of $1.5 billion and whose common stock is traded on the NASDAQ stock market as “MFNC.” The principal subsidiary of the Corporation is mBank. Headquartered in Manistique, Michigan, mBank has 29 branch locations; eleven in the Upper Peninsula, ten in the Northern Lower Peninsula, one in Oakland County, Michigan, and seven in Northern Wisconsin. The Corporation’s banking services include commercial lending and treasury management products and services geared toward small to mid-sized businesses, as well as a full array of personal and business deposit products and consumer loans.
Forward-Looking Statements
This release contains certain forward-looking statements. Words such as “anticipates,” “believes,” “estimates,” “expects,” “intends,” “should,” “will,” and variations of such words and similar expressions are intended to identify forward-looking statements: as defined by the Private Securities Litigation Reform Act of 1995. These statements reflect management’s current beliefs as to expected outcomes of future events and are not guarantees of future performance. These statements involve certain risks, uncertainties and assumptions that are difficult to predict with regard to timing, extent, likelihood, and degree of occurrence. Therefore, actual results and outcomes may materially differ from what may be expressed or forecasted in such forward-looking statements. Factors that could cause a difference include among others: the effects of the COVID-19 pandemic, particularly potentially negative effects on our customers, borrowers, third party service providers and our liquidity; changes in the national and local economies or market conditions; changes in interest rates and banking regulations; the impact of competition from traditional or new sources; and the possibility that anticipated cost savings and revenue enhancements from mergers and acquisitions, bank consolidations, and other sources may not be fully realized at all or within specified time frames as well as other risks and uncertainties including but not limited to those detailed from time to time in filings of the Corporation with the Securities and Exchange Commission. These and other factors may cause decisions and actual results to differ materially from current expectations. Mackinac Financial Corporation undertakes no obligation to revise, update, or clarify forward-looking statements to reflect events or conditions after the date of this release.
MACKINAC FINANCIAL CORPORATION AND SUBSIDIARIES
SELECTED FINANCIAL HIGHLIGHTS
As of and For the | As of and For the | As of and For the | |||||||
Period Ending | Year Ending | Period Ending | |||||||
September 30, | December 31, | September 30, | |||||||
(Dollars in thousands, except per share data) | 2020 | 2019 | 2019 | ||||||
(Unaudited) | (Unaudited) | ||||||||
Selected Financial Condition Data (at end of period): | |||||||||
Assets | $ | 1,522,917 | $ | 1,320,069 | $ | 1,355,383 | |||
Loans | 1,144,325 | 1,058,776 | 1,059,942 | ||||||
Investment securities | 106,830 | 107,972 | 107,091 | ||||||
Deposits | 1,280,887 | 1,075,677 | 1,113,579 | ||||||
Borrowings | 63,505 | 64,551 | 70,079 | ||||||
Shareholders' equity | 166,168 | 161,919 | 160,165 | ||||||
Selected Statements of Income Data (nine months and year ended) | |||||||||
Net interest income | $ | 40,907 | $ | 53,907 | $ | 40,557 | |||
Income before taxes | 12,442 | 17,710 | 13,361 | ||||||
Net income | 9,829 | 13,850 | 10,555 | ||||||
Income per common share - Basic | .93 | 1.29 | .98 | ||||||
Income per common share - Diluted | .93 | 1.29 | .98 | ||||||
Weighted average shares outstanding - Basic | 10,594,824 | 10,737,653 | 10,733,926 | ||||||
Weighted average shares outstanding - Diluted | 10,599,035 | 10,757,507 | 10,744,119 | ||||||
Three Months Ended: | |||||||||
Net interest income | $ | 13,052 | $ | 13,350 | $ | 13,324 | |||
Income before taxes | 4,207 | 4,350 | 4,708 | ||||||
Net income | 3,324 | 3,296 | 3,719 | ||||||
Income per common share - Basic | .32 | .31 | .35 | ||||||
Income per common share - Diluted | .32 | .31 | .35 | ||||||
Weighted average shares outstanding - Basic | 10,533,589 | 10,748,712 | 10,740,712 | ||||||
Weighted average shares outstanding - Diluted | 10,473,827 | 10,768,841 | 10,752,178 | ||||||
Selected Financial Ratios and Other Data: | |||||||||
Performance Ratios: | |||||||||
Net interest margin | 4.35 | % | 4.57 | % | 4.61 | % | |||
Efficiency ratio | 72.55 | 69.10 | 68.81 | ||||||
Return on average assets | .90 | 1.04 | 1.06 | ||||||
Return on average equity | 8.03 | 8.78 | 9.01 | ||||||
Average total assets | $ | 1,452,306 | $ | 1,332,882 | $ | 1,333,734 | |||
Average total shareholders' equity | 163,521 | 157,831 | 156,565 | ||||||
Average loans to average deposits ratio | 94.18 | % | 95.03 | % | 93.91 | % | |||
Common Share Data at end of period: | |||||||||
Market price per common share | $ | 9.65 | $ | 17.56 | $ | 15.46 | |||
Book value per common share | 15.78 | 15.06 | 14.91 | ||||||
Tangible book value per share | 13.49 | 12.77 | 12.60 | ||||||
Dividends paid per share, annualized | .56 | .52 | .52 | ||||||
Common shares outstanding | 10,533,589 | 10,748,712 | 10,740,712 | ||||||
Other Data at end of period: | |||||||||
Allowance for loan losses | $ | 5,832 | $ | 5,308 | $ | 5,308 | |||
Non-performing assets | $ | 7,265 | $ | 7,377 | $ | 7,473 | |||
Allowance for loan losses to total loans | .51 | % | .49 | % | .50 | % | |||
Non-performing assets to total assets | .48 | % | .56 | % | .55 | % | |||
Texas ratio | 4.91 | % | 4.41 | % | 5.31 | % | |||
Number of: | |||||||||
Branch locations | 29 | 29 | 29 | ||||||
FTE Employees | 319 | 304 | 301 | ||||||
MACKINAC FINANCIAL CORPORATION AND SUBSIDIARIES
CONSOLIDATED BALANCE SHEETS
September 30, | December 31, | September 30, | ||||||||||
2020 | 2019 | 2019 | ||||||||||
(Unaudited) | (Unaudited) | |||||||||||
ASSETS | ||||||||||||
Cash and due from banks | $ | 173,693 | $ | 49,794 | $ | 66,722 | ||||||
Federal funds sold | 76 | 32 | 16,202 | |||||||||
Cash and cash equivalents | 173,769 | 49,826 | 82,924 | |||||||||
Interest-bearing deposits in other financial institutions | 5,367 | 10,295 | 11,275 | |||||||||
Securities available for sale | 106,830 | 107,972 | 107,091 | |||||||||
Federal Home Loan Bank stock | 4,924 | 4,924 | 4,924 | |||||||||
Loans: | ||||||||||||
Commercial | 865,726 | 765,524 | 752,715 | |||||||||
Mortgage | 259,024 | 272,014 | 287,013 | |||||||||
Consumer | 19,575 | 21,238 | 20,214 | |||||||||
Total Loans | 1,144,325 | 1,058,776 | 1,059,942 | |||||||||
Allowance for loan losses | (5,832 | ) | (5,308 | ) | (5,308 | ) | ||||||
Net loans | 1,138,493 | 1,053,468 | 1,054,634 | |||||||||
Premises and equipment | 25,754 | 23,608 | 23,709 | |||||||||
Other real estate held for sale | 1,851 | 2,194 | 2,618 | |||||||||
Deferred tax asset | 1,758 | 3,732 | 4,599 | |||||||||
Deposit based intangibles | 4,537 | 5,043 | 5,212 | |||||||||
Goodwill | 19,574 | 19,574 | 19,574 | |||||||||
Other assets | 40,060 | 39,433 | 38,823 | |||||||||
TOTAL ASSETS | $ | 1,522,917 | $ | 1,320,069 | $ | 1,355,383 | ||||||
LIABILITIES AND SHAREHOLDERS EQUITY | ||||||||||||
LIABILITIES: | ||||||||||||
Deposits: | ||||||||||||
Noninterest bearing deposits | $ | 432,390 | $ | 287,611 | $ | 285,887 | ||||||
NOW, money market, interest checking | 417,508 | 373,165 | 375,267 | |||||||||
Savings | 129,633 | 109,548 | 110,455 | |||||||||
CDs<$250,000 | 215,531 | 233,956 | 250,506 | |||||||||
CDs>$250,000 | 15,654 | 12,775 | 12,964 | |||||||||
Brokered | 70,171 | 58,622 | 78,500 | |||||||||
Total deposits | 1,280,887 | 1,075,677 | 1,113,579 | |||||||||
Federal funds purchased | 6,225 | |||||||||||
Borrowings | 63,505 | 64,551 | 70,079 | |||||||||
Other liabilities | 12,357 | 11,697 | 11,560 | |||||||||
Total liabilities | 1,356,749 | 1,158,150 | 1,195,218 | |||||||||
SHAREHOLDERS EQUITY: | ||||||||||||
Common stock and additional paid in capital - No par value Authorized - 18,000,000 shares Issued and outstanding - 10,533,589; 10,748,712 and 10,740,712 respectively | 127,426 | 129,564 | 129,292 | |||||||||
Retained earnings | 37,144 | 31,740 | 29,949 | |||||||||
Accumulated other comprehensive income (loss) | ||||||||||||
Unrealized (losses) gains on available for sale securities | 2,008 | 1,025 | 1,142 | |||||||||
Minimum pension liability | (410 | ) | (410 | ) | (218 | ) | ||||||
Total shareholders equity | 166,168 | 161,919 | 160,165 | |||||||||
TOTAL LIABILITIES AND SHAREHOLDERS EQUITY | $ | 1,522,917 | $ | 1,320,069 | $ | 1,355,383 | ||||||
MACKINAC FINANCIAL CORPORATION AND SUBSIDIARIES
CONSOLIDATED STATEMENTS OF OPERATIONS
For the Three Months Ended | For the Nine Months Ended | |||||||||||||
September 30, | September 30, | |||||||||||||
2020 | 2019 | 2020 | 2019 | |||||||||||
(Unaudited) | (Unaudited) | |||||||||||||
INTEREST INCOME: | ||||||||||||||
Interest and fees on loans: | ||||||||||||||
Taxable | $ | 13,853 | $ | 14,829 | $ | 44,014 | $ | 45,010 | ||||||
Tax-exempt | 47 | 45 | 176 | 134 | ||||||||||
Interest on securities: | ||||||||||||||
Taxable | 520 | 675 | 1,700 | 2,058 | ||||||||||
Tax-exempt | 150 | 78 | 390 | 261 | ||||||||||
Other interest income | 118 | 403 | 514 | 1,155 | ||||||||||
Total interest income | 14,688 | 16,030 | 46,794 | 48,618 | ||||||||||
INTEREST EXPENSE: | ||||||||||||||
Deposits | 1,353 | 2,464 | 4,986 | 7,333 | ||||||||||
Borrowings | 283 | 242 | 901 | 728 | ||||||||||
Total interest expense | 1,636 | 2,706 | 5,887 | 8,061 | ||||||||||
Net interest income | 13,052 | 13,324 | 40,907 | 40,557 | ||||||||||
Provision for loan losses | 400 | 50 | 600 | 350 | ||||||||||
Net interest income after provision for loan losses | 12,652 | 13,274 | 40,307 | 40,207 | ||||||||||
OTHER INCOME: | ||||||||||||||
Deposit service fees | 260 | 383 | 900 | 1,197 | ||||||||||
Income from loans sold on the secondary market | 1,968 | 586 | 4,018 | 1,253 | ||||||||||
SBA/USDA loan sale gains | 477 | 496 | 1,460 | 650 | ||||||||||
Mortgage servicing amortization | 247 | 238 | 640 | 486 | ||||||||||
Net security gains | - | - | - | - | ||||||||||
Other | 164 | 175 | 402 | 519 | ||||||||||
Total other income | 3,116 | 1,878 | 7,420 | 4,105 | ||||||||||
OTHER EXPENSE: | ||||||||||||||
Salaries and employee benefits | 6,487 | 5,669 | 19,547 | 16,615 | ||||||||||
Occupancy | 1,163 | 987 | 3,295 | 3,072 | ||||||||||
Furniture and equipment | 846 | 768 | 2,452 | 2,209 | ||||||||||
Data processing | 801 | 785 | 2,478 | 2,202 | ||||||||||
Advertising | 168 | 203 | 692 | 726 | ||||||||||
Professional service fees | 474 | 536 | 1,546 | 1,517 | ||||||||||
Loan origination expenses and deposit and card related fees | 413 | 314 | 1,200 | 677 | ||||||||||
Writedowns and losses on other real estate held for sale | (20 | ) | (24 | ) | 13 | 77 | ||||||||
FDIC insurance assessment | 135 | (141 | ) | 450 | 70 | |||||||||
Communications expense | 248 | 221 | 685 | 681 | ||||||||||
Transaction related expenses | - | - | - | - | ||||||||||
Other | 846 | 1,126 | 2,927 | 3,105 | ||||||||||
Total other expenses | 11,561 | 10,444 | 35,285 | 30,951 | ||||||||||
Income before provision for income taxes | 4,207 | 4,708 | 12,442 | 13,361 | ||||||||||
Provision for income taxes | 883 | 989 | 2,613 | 2,806 | ||||||||||
NET INCOME AVAILABLE TO COMMON SHAREHOLDERS | $ | 3,324 | $ | 3,719 | $ | 9,829 | $ | 10,555 | ||||||
INCOME PER COMMON SHARE: | ||||||||||||||
Basic | $ | .32 | $ | .35 | $ | .93 | $ | .98 | ||||||
Diluted | $ | .32 | $ | .35 | $ | .93 | $ | .98 | ||||||
MACKINAC FINANCIAL CORPORATION AND SUBSIDIARIES
LOAN PORTFOLIO AND CREDIT QUALITY
(Dollars in thousands)
Loan Portfolio Balances (at end of period):
September 30, | December 31, | September 30, | ||||||
2020 | 2019 | 2019 | ||||||
(Unaudited) | (Audited) | (Unaudited) | ||||||
Commercial Loans: | ||||||||
Real estate - operators of nonresidential buildings | $ | 136,372 | $ | 141,965 | $ | 142,176 | ||
Hospitality and tourism | 100,524 | 97,721 | 94,143 | |||||
Lessors of residential buildings | 49,694 | 51,085 | 50,891 | |||||
Gasoline stations and convenience stores | 27,965 | 27,176 | 24,917 | |||||
Logging | 21,487 | 22,136 | 22,725 | |||||
Commercial construction | 39,162 | 40,107 | 34,511 | |||||
Other | 490,522 | 385,334 | 383,352 | |||||
Total Commercial Loans | 865,726 | 765,524 | 752,715 | |||||
1-4 family residential real estate | 237,336 | 253,918 | 268,333 | |||||
Consumer | 19,575 | 21,238 | 20,214 | |||||
Consumer construction | 21,688 | 18,096 | 18,680 | |||||
Total Loans | $ | 1,144,325 | $ | 1,058,776 | $ | 1,059,942 | ||
Credit Quality (at end of period):
September 30, | December 31, | September 30, | |||||||
2020 | 2019 | 2019 | |||||||
(Unaudited) | (Audited) | (Unaudited) | |||||||
Nonperforming Assets : | |||||||||
Nonaccrual loans | $ | 5,414 | $ | 5,172 | $ | 4,844 | |||
Loans past due 90 days or more | - | 11 | 11 | ||||||
Restructured loans | - | - | - | ||||||
Total nonperforming loans | 5,414 | 5,183 | 4,855 | ||||||
Other real estate owned | 1,851 | 2,194 | 2,618 | ||||||
Total nonperforming assets | $ | 7,265 | $ | 7,377 | $ | 7,473 | |||
Nonperforming loans as a % of loans | .47 | % | .49 | % | .46 | % | |||
Nonperforming assets as a % of assets | .48 | % | .56 | % | .55 | % | |||
Reserve for Loan Losses: | |||||||||
At period end | $ | 5,832 | $ | 5,308 | $ | 5,308 | |||
As a % of outstanding loans | .51 | % | .50 | % | .50 | % | |||
As a % of nonperforming loans | 107.72 | % | 102.41 | % | 109.33 | % | |||
As a % of nonaccrual loans | 107.72 | % | 102.63 | % | 109.58 | % | |||
Texas Ratio | 4.91 | % | 4.41 | % | 5.31 | % | |||
Charge-off Information (year to date): | |||||||||
Average loans | $ | 1,116,617 | $ | 1,047,439 | $ | 1,041,991 | |||
Net charge-offs (recoveries) | $ | 76 | $ | 260 | $ | 225 | |||
Charge-offs as a % of average loans, annualized | .01 | % | .02 | % | .03 | % | |||
MACKINAC FINANCIAL CORPORATION AND SUBSIDIARIES
QUARTERLY FINANCIAL HIGHLIGHTS
QUARTER ENDED | |||||||||||||||||||
(Unaudited) | |||||||||||||||||||
September 30, | June 30, | March 31, | December 31, | September 30, | |||||||||||||||
2020 | 2020 | 2020 | 2019 | 2019 | |||||||||||||||
BALANCE SHEET (Dollars in thousands) | |||||||||||||||||||
Total loans | $ | 1,144,325 | $ | 1,153,790 | $ | 1,044,177 | $ | 1,058,776 | $ | 1,059,942 | |||||||||
Allowance for loan losses | (5,832 | ) | (5,355 | ) | (5,292 | ) | (5,308 | ) | (5,308 | ) | |||||||||
Total loans, net | 1,138,493 | 1,148,435 | 1,038,885 | 1,053,468 | 1,054,634 | ||||||||||||||
Total assets | 1,522,917 | 1,518,473 | 1,356,381 | 1,320,069 | 1,355,383 | ||||||||||||||
Core deposits | 1,195,062 | 1,122,582 | 984,936 | 1,004,280 | 1,022,115 | ||||||||||||||
Noncore deposits | 85,825 | 104,970 | 110,445 | 71,397 | 91,464 | ||||||||||||||
Total deposits | 1,280,887 | 1,227,552 | 1,095,381 | 1,075,677 | 1,113,579 | ||||||||||||||
Total borrowings | 63,505 | 114,466 | 67,120 | 64,551 | 70,079 | ||||||||||||||
Total shareholders' equity | 166,168 | 164,157 | 160,060 | 161,919 | 160,165 | ||||||||||||||
Total tangible equity | 142,057 | 139,877 | 135,612 | 137,302 | 135,379 | ||||||||||||||
Total shares outstanding | 10,533,589 | 10,533,589 | 10,533,589 | 10,748,712 | 10,740,712 | ||||||||||||||
Weighted average shares outstanding | 10,533,589 | 10,533,589 | 10,717,967 | 10,748,712 | 10,740,712 | ||||||||||||||
AVERAGE BALANCES (Dollars in thousands) | |||||||||||||||||||
Assets | $ | 1,536,128 | $ | 1,501,423 | $ | 1,321,134 | $ | 1,347,916 | $ | 1,354,220 | |||||||||
Earning assets | 1,303,102 | 1,290,012 | 1,171,551 | 1,205,241 | 1,204,782 | ||||||||||||||
Loans | 1,154,670 | 1,147,620 | 1,047,144 | 1,081,294 | 1,065,337 | ||||||||||||||
Noninterest bearing deposits | 422,134 | 346,180 | 284,677 | 283,259 | 284,354 | ||||||||||||||
Deposits | 1,269,658 | 1,211,694 | 1,076,206 | 1,080,359 | 1,124,433 | ||||||||||||||
Equity | 165,450 | 161,811 | 162,661 | 161,588 | 159,453 | ||||||||||||||
INCOME STATEMENT (Dollars in thousands) | |||||||||||||||||||
Net interest income | $ | 13,052 | $ | 14,458 | $ | 13,397 | $ | 13,350 | $ | 13,324 | |||||||||
Provision for loan losses | 400 | 100 | 100 | 35 | 50 | ||||||||||||||
Net interest income after provision | 12,652 | 14,358 | 13,297 | 13,315 | 13,274 | ||||||||||||||
Total noninterest income | 3,116 | 2,367 | 1,937 | 1,848 | 1,878 | ||||||||||||||
Total noninterest expense | 11,561 | 12,352 | 11,372 | 10,813 | 10,444 | ||||||||||||||
Income before taxes | 4,207 | 4,373 | 3,862 | 4,350 | 4,708 | ||||||||||||||
Provision for income taxes | 883 | 919 | 811 | 1,054 | 989 | ||||||||||||||
Net income available to common shareholders | $ | 3,324 | $ | 3,454 | $ | 3,051 | $ | 3,296 | $ | 3,719 | |||||||||
Income pre-tax, pre-provision | $ | 3,724 | $ | 4,473 | $ | 3,962 | $ | 4,385 | $ | 4,758 | |||||||||
PER SHARE DATA | |||||||||||||||||||
Earnings per common share | $ | .32 | $ | .33 | $ | .28 | $ | .31 | $ | .35 | |||||||||
Book value per common share | 15.78 | 15.58 | 15.20 | 15.06 | 14.91 | ||||||||||||||
Tangible book value per share | 13.49 | 13.28 | 12.87 | 12.77 | 12.60 | ||||||||||||||
Market value, closing price | 9.65 | 10.37 | 10.45 | 17.56 | 15.46 | ||||||||||||||
Dividends per share | .14 | .14 | .14 | .14 | .14 | ||||||||||||||
ASSET QUALITY RATIOS | |||||||||||||||||||
Nonperforming loans/total loans | .47 | % | .53 | % | .61 | % | .49 | % | .46 | % | |||||||||
Nonperforming assets/total assets | .48 | .55 | .64 | .56 | .55 | ||||||||||||||
Allowance for loan losses/total loans | .51 | .46 | .51 | .50 | .50 | ||||||||||||||
Allowance for loan losses/nonperforming loans | 107.72 | 87.44 | 82.48 | 102.41 | 109.33 | ||||||||||||||
Texas ratio | 4.91 | 4.22 | 6.13 | 4.41 | 5.31 | ||||||||||||||
PROFITABILITY RATIOS | |||||||||||||||||||
Return on average assets | .86 | % | .93 | % | .93 | % | .97 | % | 1.09 | % | |||||||||
Return on average equity | 7.99 | 8.58 | 7.54 | 8.09 | 9.25 | ||||||||||||||
Net interest margin | 3.98 | 4.51 | 4.60 | 4.39 | 4.39 | ||||||||||||||
Average loans/average deposits | 90.94 | 94.71 | 97.30 | 100.09 | 94.74 | ||||||||||||||
CAPITAL ADEQUACY RATIOS | |||||||||||||||||||
Tier 1 leverage ratio | 9.20 | % | 9.45 | % | 10.20 | % | 10.09 | % | 9.81 | % | |||||||||
Tier 1 capital to risk weighted assets | 13.91 | 13.27 | 12.89 | 12.71 | 12.39 | ||||||||||||||
Total capital to risk weighted assets | 14.49 | 13.79 | 13.41 | 13.22 | 12.90 | ||||||||||||||
Average equity/average assets (for the quarter) | 10.77 | 10.78 | 12.31 | 11.99 | 11.77 | ||||||||||||||
Contact: | Jesse A. Deering, EVP & Chief Financial Officer (248) 290-5906 / jdeering@bankmbank.com | |
