Has Main Street Capital Corporation (NYSE:MAIN) Improved Earnings Growth In Recent Times?

After looking at Main Street Capital Corporation’s (NYSE:MAIN) latest earnings update (31 March 2018), I found it helpful to revisit the company’s performance in the past couple of years and compare this against the latest numbers. As a long-term investor I tend to focus on earnings trend, rather than a single number at one point in time. Also, comparing it against an industry benchmark to understand whether it outperformed, or is simply riding an industry wave, is an important aspect. In this article I briefly touch on my key findings. Check out our latest analysis for Main Street Capital
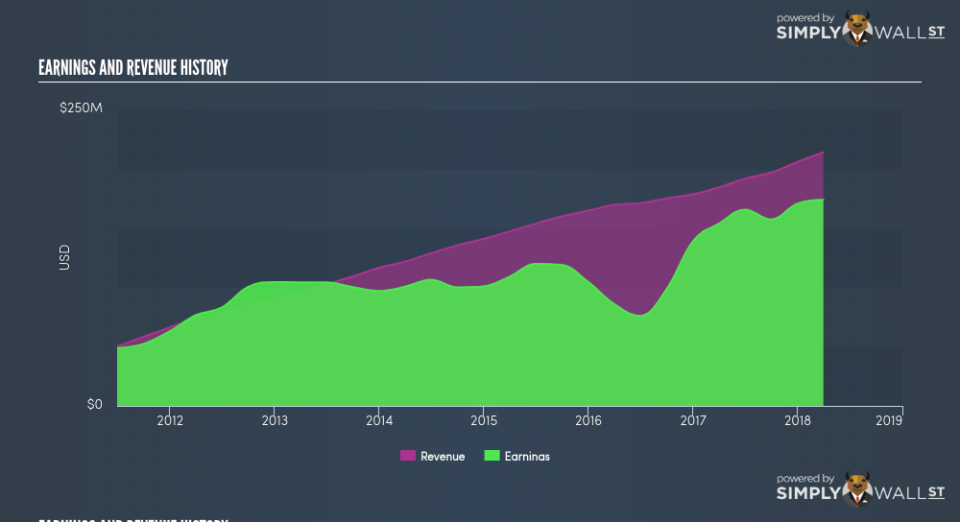
How MAIN fared against its long-term earnings performance and its industry
MAIN’s trailing twelve-month earnings (from 31 March 2018) of US$173.69m has jumped 13.13% compared to the previous year. Furthermore, this one-year growth rate has exceeded its 5-year annual growth average of 12.21%, indicating the rate at which MAIN is growing has accelerated. What’s enabled this growth? Let’s see if it is only owing to an industry uplift, or if Main Street Capital has seen some company-specific growth.
The climb in earnings seems to be supported by a solid top-line increase overtaking its growth rate of expenses. Though this resulted in a margin contraction, it has made Main Street Capital more profitable. Inspecting growth from a sector-level, the US capital markets industry has been growing its average earnings by double-digit 14.56% in the prior twelve months, and 11.50% over the past half a decade. This means that whatever uplift the industry is deriving benefit from, Main Street Capital has not been able to gain as much as its industry peers.
In terms of returns from investment, Main Street Capital has not invested its equity funds well, leading to a 12.44% return on equity (ROE), below the sensible minimum of 20%. However, its return on assets (ROA) of 8.82% exceeds the US Capital Markets industry of 4.83%, indicating Main Street Capital has used its assets more efficiently. And finally, its return on capital (ROC), which also accounts for Main Street Capital’s debt level, has increased over the past 3 years from 5.63% to 6.02%.
What does this mean?
Though Main Street Capital’s past data is helpful, it is only one aspect of my investment thesis. While Main Street Capital has a good historical track record with positive growth and profitability, there’s no certainty that this will extrapolate into the future. I suggest you continue to research Main Street Capital to get a better picture of the stock by looking at:
Future Outlook: What are well-informed industry analysts predicting for MAIN’s future growth? Take a look at our free research report of analyst consensus for MAIN’s outlook.
Financial Health: Is MAIN’s operations financially sustainable? Balance sheets can be hard to analyze, which is why we’ve done it for you. Check out our financial health checks here.
Other High-Performing Stocks: Are there other stocks that provide better prospects with proven track records? Explore our free list of these great stocks here.
NB: Figures in this article are calculated using data from the trailing twelve months from 31 March 2018. This may not be consistent with full year annual report figures.
To help readers see pass the short term volatility of the financial market, we aim to bring you a long-term focused research analysis purely driven by fundamental data. Note that our analysis does not factor in the latest price sensitive company announcements.
The author is an independent contributor and at the time of publication had no position in the stocks mentioned.
