Is Mainfreight Limited's (NZSE:MFT) P/E Ratio Really That Good?

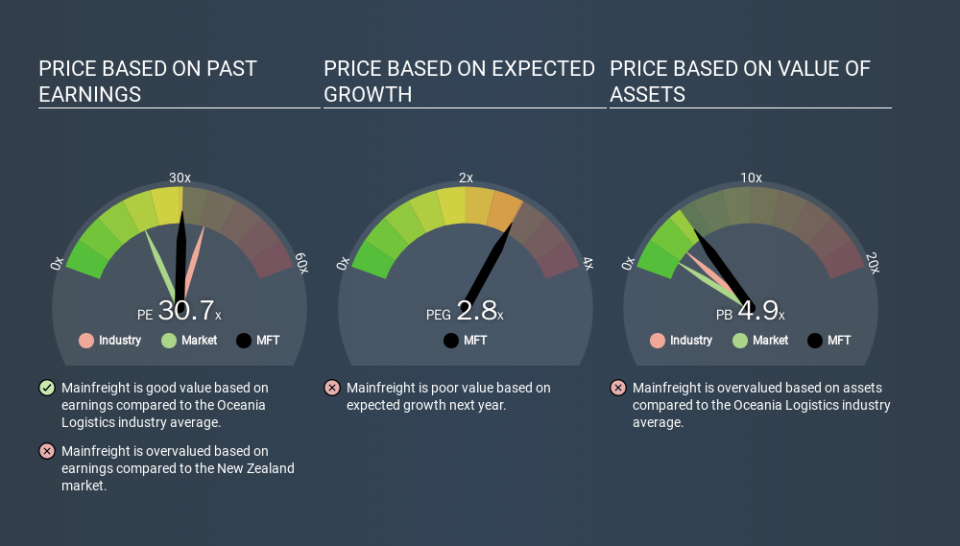
This article is for investors who would like to improve their understanding of price to earnings ratios (P/E ratios). We'll apply a basic P/E ratio analysis to Mainfreight Limited's (NZSE:MFT), to help you decide if the stock is worth further research. Mainfreight has a price to earnings ratio of 30.71, based on the last twelve months. That means that at current prices, buyers pay NZ$30.71 for every NZ$1 in trailing yearly profits.
Check out our latest analysis for Mainfreight
How Do I Calculate A Price To Earnings Ratio?
The formula for P/E is:
Price to Earnings Ratio = Price per Share ÷ Earnings per Share (EPS)
Or for Mainfreight:
P/E of 30.71 = NZD43.01 ÷ NZD1.40 (Based on the trailing twelve months to September 2019.)
Is A High P/E Ratio Good?
A higher P/E ratio implies that investors pay a higher price for the earning power of the business. That isn't necessarily good or bad, but a high P/E implies relatively high expectations of what a company can achieve in the future.
Does Mainfreight Have A Relatively High Or Low P/E For Its Industry?
One good way to get a quick read on what market participants expect of a company is to look at its P/E ratio. If you look at the image below, you can see Mainfreight has a lower P/E than the average (37.2) in the logistics industry classification.
Its relatively low P/E ratio indicates that Mainfreight shareholders think it will struggle to do as well as other companies in its industry classification. Since the market seems unimpressed with Mainfreight, it's quite possible it could surprise on the upside. You should delve deeper. I like to check if company insiders have been buying or selling.
How Growth Rates Impact P/E Ratios
P/E ratios primarily reflect market expectations around earnings growth rates. Earnings growth means that in the future the 'E' will be higher. And in that case, the P/E ratio itself will drop rather quickly. And as that P/E ratio drops, the company will look cheap, unless its share price increases.
Most would be impressed by Mainfreight earnings growth of 16% in the last year. And it has bolstered its earnings per share by 11% per year over the last five years. So one might expect an above average P/E ratio.
Don't Forget: The P/E Does Not Account For Debt or Bank Deposits
Don't forget that the P/E ratio considers market capitalization. So it won't reflect the advantage of cash, or disadvantage of debt. In theory, a company can lower its future P/E ratio by using cash or debt to invest in growth.
Such spending might be good or bad, overall, but the key point here is that you need to look at debt to understand the P/E ratio in context.
So What Does Mainfreight's Balance Sheet Tell Us?
Mainfreight's net debt is 4.2% of its market cap. The market might award it a higher P/E ratio if it had net cash, but its unlikely this low level of net borrowing is having a big impact on the P/E multiple.
The Verdict On Mainfreight's P/E Ratio
Mainfreight trades on a P/E ratio of 30.7, which is above its market average of 19.8. The company is not overly constrained by its modest debt levels, and its recent EPS growth very solid. So on this analysis it seems reasonable that its P/E ratio is above average.
Investors should be looking to buy stocks that the market is wrong about. If the reality for a company is better than it expects, you can make money by buying and holding for the long term. So this free visual report on analyst forecasts could hold the key to an excellent investment decision.
Of course, you might find a fantastic investment by looking at a few good candidates. So take a peek at this free list of companies with modest (or no) debt, trading on a P/E below 20.
If you spot an error that warrants correction, please contact the editor at editorial-team@simplywallst.com. This article by Simply Wall St is general in nature. It does not constitute a recommendation to buy or sell any stock, and does not take account of your objectives, or your financial situation. Simply Wall St has no position in the stocks mentioned.
We aim to bring you long-term focused research analysis driven by fundamental data. Note that our analysis may not factor in the latest price-sensitive company announcements or qualitative material. Thank you for reading.
