Who Are The Major Shareholders In Merlin Diamonds Limited (ASX:MED)?

Today, I will be analyzing Merlin Diamonds Limited’s (ASX:MED) recent ownership structure, an important but not-so-popular subject among individual investors. A company’s ownership structure is often linked to its share performance in both the long- and short-term. Since the same amount of capital coming from an activist institution and a passive mutual fund has different implications on corporate governance, it is a useful exercise to deconstruct MED’s shareholder registry.
View our latest analysis for Merlin Diamonds
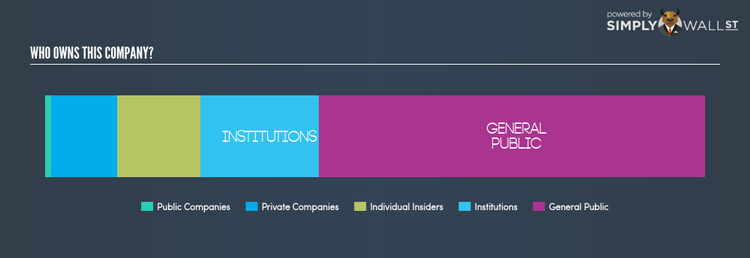
Institutional Ownership
MED’s 17.88% institutional ownership seems enough to cause large share price movements in the case of significant share sell-off or acquisitions by institutions, particularly when there is a low level of public shares available on the market to trade. However, as not all institutions are alike, such high volatility events, especially in the short-term, have been more frequently linked to active market participants like hedge funds. In the case of MED, investors need not worry about such volatility considering active hedge funds don’t have a significant stake. However, we should dig deeper into MED’s ownership structure and find out how other key ownership classes can affect its investment profile.
Insider Ownership
Insiders form another group of important ownership types as they manage the company’s operations and decide the best use of capital. Insider ownership has been linked to better alignment between management and shareholders. MED insiders hold a significant stake of 12.71% in the company. This level of insider ownership has been found to have a negative impact on companies with consistently low PE ratios (underperformers), while it has been positive in the case of high PE ratio firms (outperformers). It may be interesting to take a look at what company insiders have been doing with their holdings lately. Insiders buying company shares can be a positive indicator of future performance, but a selling decision can simply be driven by personal financial needs.
General Public Ownership
A substantial ownership of 58.44% in MED is held by the general public. With this size of ownership, retail investors can collectively play a role in major company policies that affect shareholders returns, including executive remuneration and the appointment of directors. They can also exercise the power to decline an acquisition or merger that may not improve profitability.
Private Company Ownership
Another group of owners that a potential investor in MED should consider are private companies, with a stake of 9.96%. While they invest more often due to strategic interests, an investment can also be driven by capital gains through share price appreciation. An ownership of this size indicates a strong financial backing and has the potential to influence MED’s business strategy. Thus, investors should dig deeper into MED’s business relations with these companies and how it can affect shareholder returns in the long-term.
Next Steps:
MED’s considerably high level of institutional ownership calls for further analysis into its margin of safety. This is to avoid getting trapped in a sustained sell-off that is often observed in stocks with this level of institutional participation. However, ownership structure should not be the only focus of your research when constructing an investment thesis around MED. Rather, you should be looking at fundamental drivers such as the intrinsic valuation, which is a key driver of Merlin Diamonds’s share price. I urge you to complete your research by taking a look at the following:
1. Financial Health: Is MED’s operations financially sustainable? Balance sheets can be hard to analyze, which is why we’ve done it for you. Check out our financial health checks here.
2. Past Track Record: Has MED been consistently performing well irrespective of the ups and downs in the market? Go into more detail in the past performance analysis and take a look at the free visual representations of MED’s historicals for more clarity.
3. Other High-Performing Stocks: Are there other stocks that provide better prospects with proven track records? Explore our free list of these great stocks here.
NB: Figures in this article are calculated using data from the last twelve months, which refer to the 12-month period ending on the last date of the month the financial statement is dated. This may not be consistent with full year annual report figures.
To help readers see pass the short term volatility of the financial market, we aim to bring you a long-term focused research analysis purely driven by fundamental data. Note that our analysis does not factor in the latest price sensitive company announcements.
The author is an independent contributor and at the time of publication had no position in the stocks mentioned.
