Manchester United plc (NYSE:MANU): Can It Deliver A Superior ROE To The Industry?

This article is intended for those of you who are at the beginning of your investing journey and want to begin learning the link between company’s fundamentals and stock market performance.
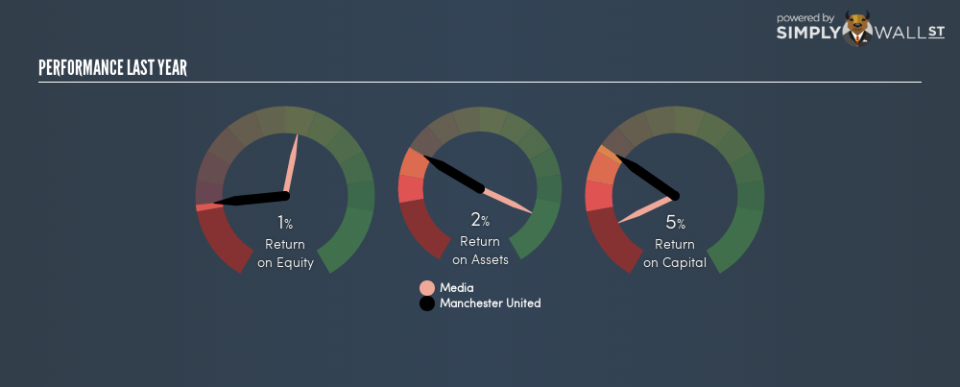
Manchester United plc (NYSE:MANU) generated a below-average return on equity of 0.7% in the past 12 months, while its industry returned 17.8%. An investor may attribute an inferior ROE to a relatively inefficient performance, and whilst this can often be the case, knowing the nuts and bolts of the ROE calculation may change that perspective and give you a deeper insight into MANU’s past performance. I will take you through how metrics such as financial leverage impact ROE which may affect the overall sustainability of MANU’s returns.
View our latest analysis for Manchester United
Breaking down ROE — the mother of all ratios
Return on Equity (ROE) is a measure of Manchester United’s profit relative to its shareholders’ equity. For example, if the company invests $1 in the form of equity, it will generate $0.0069 in earnings from this. In most cases, a higher ROE is preferred; however, there are many other factors we must consider prior to making any investment decisions.
Return on Equity = Net Profit ÷ Shareholders Equity
Returns are usually compared to costs to measure the efficiency of capital. Manchester United’s cost of equity is 10.7%. This means Manchester United’s returns actually do not cover its own cost of equity, with a discrepancy of -10.0%. This isn’t sustainable as it implies, very simply, that the company pays more for its capital than what it generates in return. ROE can be dissected into three distinct ratios: net profit margin, asset turnover, and financial leverage. This is called the Dupont Formula:
Dupont Formula
ROE = profit margin × asset turnover × financial leverage
ROE = (annual net profit ÷ sales) × (sales ÷ assets) × (assets ÷ shareholders’ equity)
ROE = annual net profit ÷ shareholders’ equity
Essentially, profit margin shows how much money the company makes after paying for all its expenses. Asset turnover reveals how much revenue can be generated from Manchester United’s asset base. Finally, financial leverage will be our main focus today. It shows how much of assets are funded by equity and can show how sustainable the company’s capital structure is. Since ROE can be artificially increased through excessive borrowing, we should check Manchester United’s historic debt-to-equity ratio. At 99.2%, Manchester United’s debt-to-equity ratio appears balanced and indicates its ROE is generated from its capacity to increase profit without a large debt burden.

Next Steps:
ROE is one of many ratios which meaningfully dissects financial statements, which illustrates the quality of a company. Manchester United’s below-industry ROE is disappointing, furthermore, its returns were not even high enough to cover its own cost of equity. However, ROE is not likely to be inflated by excessive debt funding, giving shareholders more conviction in the sustainability of returns, which has headroom to increase further. ROE is a helpful signal, but it is definitely not sufficient on its own to make an investment decision.
For Manchester United, I’ve compiled three important factors you should further examine:
Financial Health: Does it have a healthy balance sheet? Take a look at our free balance sheet analysis with six simple checks on key factors like leverage and risk.
Valuation: What is Manchester United worth today? Is the stock undervalued, even when its growth outlook is factored into its intrinsic value? The intrinsic value infographic in our free research report helps visualize whether Manchester United is currently mispriced by the market.
Other High-Growth Alternatives : Are there other high-growth stocks you could be holding instead of Manchester United? Explore our interactive list of stocks with large growth potential to get an idea of what else is out there you may be missing!
To help readers see past the short term volatility of the financial market, we aim to bring you a long-term focused research analysis purely driven by fundamental data. Note that our analysis does not factor in the latest price-sensitive company announcements.
The author is an independent contributor and at the time of publication had no position in the stocks mentioned. For errors that warrant correction please contact the editor at editorial-team@simplywallst.com.
