How Many Australia and New Zealand Banking Group Limited (ASX:ANZ) Shares Do Institutions Own?

Want to participate in a research study? Help shape the future of investing tools and earn a $60 gift card!
If you want to know who really controls Australia and New Zealand Banking Group Limited (ASX:ANZ), then you'll have to look at the makeup of its share registry. Insiders often own a large chunk of younger, smaller, companies while huge companies tend to have institutions as shareholders. Companies that have been privatized tend to have low insider ownership.
With a market capitalization of AU$73b, Australia and New Zealand Banking Group is rather large. We'd expect to see institutional investors on the register. Companies of this size are usually well known to retail investors, too. In the chart below below, we can see that institutional investors have bought into the company. Let's delve deeper into each type of owner, to discover more about ANZ.
Check out our latest analysis for Australia and New Zealand Banking Group

What Does The Institutional Ownership Tell Us About Australia and New Zealand Banking Group?
Institutional investors commonly compare their own returns to the returns of a commonly followed index. So they generally do consider buying larger companies that are included in the relevant benchmark index.
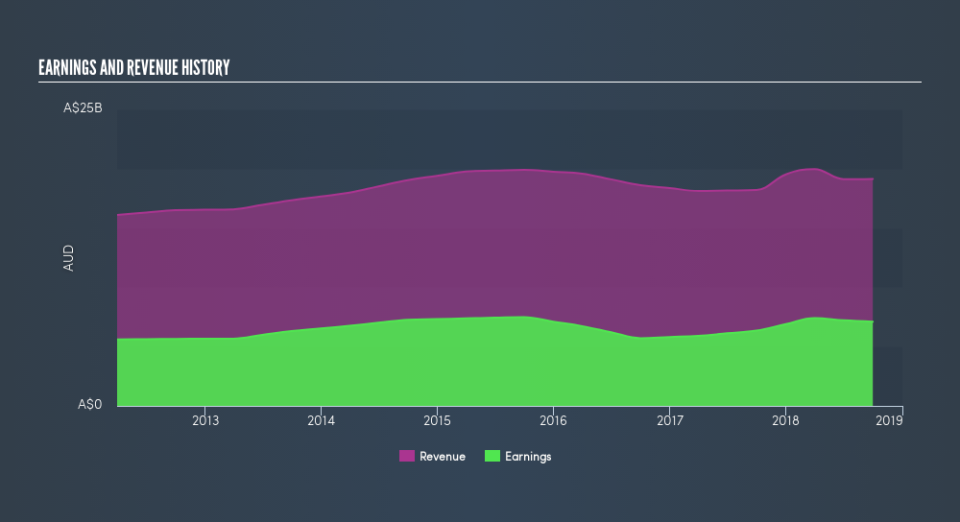
Australia and New Zealand Banking Group already has institutions on the share registry. Indeed, they own 17% of the company. This suggests some credibility amongst professional investors. But we can't rely on that fact alone, since institutions make bad investments sometimes, just like everyone does. When multiple institutions own a stock, there's always a risk that they are in a 'crowded trade'. When such a trade goes wrong, multiple parties may compete to sell stock fast. This risk is higher in a company without a history of growth. You can see Australia and New Zealand Banking Group's historic earnings and revenue, below, but keep in mind there's always more to the story.
Hedge funds don't have many shares in Australia and New Zealand Banking Group. Quite a few analysts cover the stock, so you could look into forecast growth quite easily.
Insider Ownership Of Australia and New Zealand Banking Group
The definition of company insiders can be subjective, and does vary between jurisdictions. Our data reflects individual insiders, capturing board members at the very least. Management ultimately answers to the board. However, it is not uncommon for managers to be executive board members, especially if they are a founder or the CEO.
Insider ownership is positive when it signals leadership are thinking like the true owners of the company. However, high insider ownership can also give immense power to a small group within the company. This can be negative in some circumstances.
Our data suggests that insiders own under 1% of Australia and New Zealand Banking Group Limited in their own names. Being so large, we would not expect insiders to own a large proportion of the stock. Collectively, they own AU$31m of stock. Arguably recent buying and selling is just as important to consider. You can click here to see if insiders have been buying or selling.
General Public Ownership
The general public -- mostly retail investors -- own 82% of Australia and New Zealand Banking Group . With this size of ownership, retail investors can collectively play a role in decisions that affect shareholder returns, such as dividend policies and the appointment of directors. They can also exercise the power to decline an acquisition or merger that may not improve profitability.
Next Steps:
It's always worth thinking about the different groups who own shares in a company. But to understand Australia and New Zealand Banking Group better, we need to consider many other factors.
I like to dive deeper into how a company has performed in the past. You can access this interactive graph of past earnings, revenue and cash flow, for free .
But ultimately it is the future, not the past, that will determine how well the owners of this business will do. Therefore we think it advisable to take a look at this free report showing whether analysts are predicting a brighter future.
NB: Figures in this article are calculated using data from the last twelve months, which refer to the 12-month period ending on the last date of the month the financial statement is dated. This may not be consistent with full year annual report figures.
We aim to bring you long-term focused research analysis driven by fundamental data. Note that our analysis may not factor in the latest price-sensitive company announcements or qualitative material.
If you spot an error that warrants correction, please contact the editor at editorial-team@simplywallst.com. This article by Simply Wall St is general in nature. It does not constitute a recommendation to buy or sell any stock, and does not take account of your objectives, or your financial situation. Simply Wall St has no position in the stocks mentioned. Thank you for reading.
