How Many Hancock Whitney Corporation (NASDAQ:HWC) Shares Do Institutions Own?
A look at the shareholders of Hancock Whitney Corporation (NASDAQ:HWC) can tell us which group is most powerful. Generally speaking, as a company grows, institutions will increase their ownership. Conversely, insiders often decrease their ownership over time. Companies that have been privatized tend to have low insider ownership.
Hancock Whitney has a market capitalization of US$4.3b, so it's too big to fly under the radar. We'd expect to see both institutions and retail investors owning a portion of the company. Taking a look at our data on the ownership groups (below), it seems that institutions are noticeable on the share registry. Let's take a closer look to see what the different types of shareholders can tell us about Hancock Whitney.
Check out our latest analysis for Hancock Whitney
What Does The Institutional Ownership Tell Us About Hancock Whitney?
Many institutions measure their performance against an index that approximates the local market. So they usually pay more attention to companies that are included in major indices.
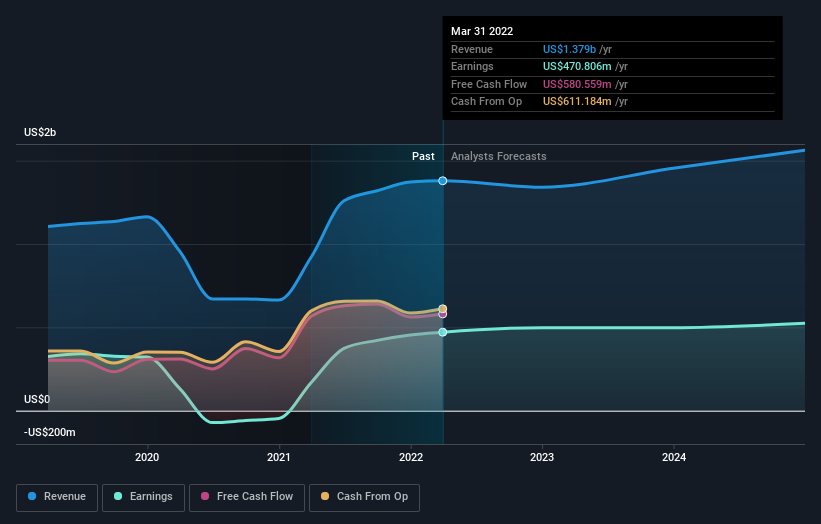
As you can see, institutional investors have a fair amount of stake in Hancock Whitney. This suggests some credibility amongst professional investors. But we can't rely on that fact alone since institutions make bad investments sometimes, just like everyone does. If multiple institutions change their view on a stock at the same time, you could see the share price drop fast. It's therefore worth looking at Hancock Whitney's earnings history below. Of course, the future is what really matters.
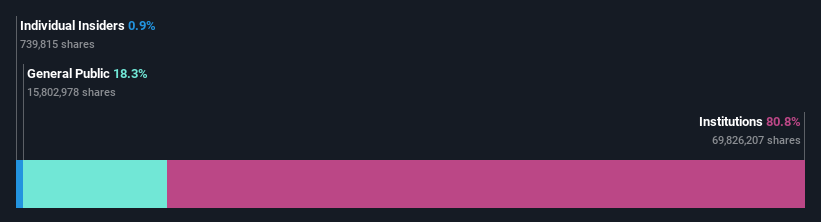
Institutional investors own over 50% of the company, so together than can probably strongly influence board decisions. Hancock Whitney is not owned by hedge funds. The company's largest shareholder is BlackRock, Inc., with ownership of 12%. In comparison, the second and third largest shareholders hold about 10% and 5.3% of the stock.
After doing some more digging, we found that the top 13 have the combined ownership of 50% in the company, suggesting that no single shareholder has significant control over the company.
While studying institutional ownership for a company can add value to your research, it is also a good practice to research analyst recommendations to get a deeper understand of a stock's expected performance. Quite a few analysts cover the stock, so you could look into forecast growth quite easily.
Insider Ownership Of Hancock Whitney
The definition of an insider can differ slightly between different countries, but members of the board of directors always count. The company management answer to the board and the latter should represent the interests of shareholders. Notably, sometimes top-level managers are on the board themselves.
I generally consider insider ownership to be a good thing. However, on some occasions it makes it more difficult for other shareholders to hold the board accountable for decisions.
Our information suggests that Hancock Whitney Corporation insiders own under 1% of the company. It is a pretty big company, so it would be possible for board members to own a meaningful interest in the company, without owning much of a proportional interest. In this case, they own around US$37m worth of shares (at current prices). It is always good to see at least some insider ownership, but it might be worth checking if those insiders have been selling.
General Public Ownership
The general public, who are usually individual investors, hold a 18% stake in Hancock Whitney. While this size of ownership may not be enough to sway a policy decision in their favour, they can still make a collective impact on company policies.
Next Steps:
I find it very interesting to look at who exactly owns a company. But to truly gain insight, we need to consider other information, too.
Many find it useful to take an in depth look at how a company has performed in the past. You can access this detailed graph of past earnings, revenue and cash flow.
Ultimately the future is most important. You can access this free report on analyst forecasts for the company.
NB: Figures in this article are calculated using data from the last twelve months, which refer to the 12-month period ending on the last date of the month the financial statement is dated. This may not be consistent with full year annual report figures.
Have feedback on this article? Concerned about the content? Get in touch with us directly. Alternatively, email editorial-team (at) simplywallst.com.
This article by Simply Wall St is general in nature. We provide commentary based on historical data and analyst forecasts only using an unbiased methodology and our articles are not intended to be financial advice. It does not constitute a recommendation to buy or sell any stock, and does not take account of your objectives, or your financial situation. We aim to bring you long-term focused analysis driven by fundamental data. Note that our analysis may not factor in the latest price-sensitive company announcements or qualitative material. Simply Wall St has no position in any stocks mentioned.
