Marimaca Drilling Intersects High Grade Extensions below the Marimaca Oxide Deposit
Figure 1
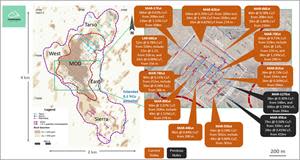
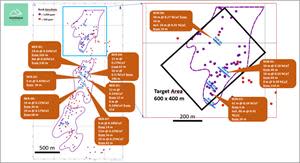
Plan view MOD exploration target and depth extension drill results
Figure 2
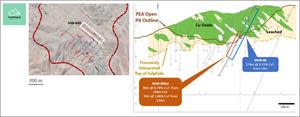
MOD Depth Extension Program Sections and PEA pit shell – NW-600
Figure 3
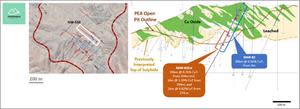
MOD Depth Extension Program Sections and PEA pit shell – NW-550
Figure 4

MOD Depth Extension Program and PEA pit shell - Section NW-450
Figure 5

MOD Depth Extension Program and PEA pit shell - Section NE-450
Figure 6

MOD Depth Extension Program and PEA pit shell - Section NE-100
Figure 7
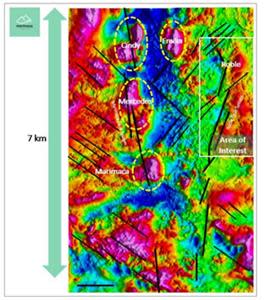
Roble target area of interest relative to the MOD and other targets
Figure 8
Significant intercepts at Nepal and Roble targets
VANCOUVER, British Columbia, Oct. 13, 2021 (GLOBE NEWSWIRE) -- Marimaca Copper Corp. (“Marimaca Copper” or the “Company”) (TSX: MARI) is pleased to announce results from the extensional drilling campaign at the Marimaca Oxide Deposit (“MOD”) and initial drilling results from the Roble Target (“Roble”), located less than 3km northeast of the MOD.
The Reverse Circulation (“RC”) drilling campaign below the MOD open pit limits has intersected significant zones of mixed, enriched and some primary sulphide mineralization, indicating the potential for the expansion of the MOD’s future leachable Mineral Resource Estimate (“MRE”) and complementing the previous drilling which also encountered significant extensions of mineralization at depth (refer to announcement on 5th of May 2021). A total of 3,120m in 12 re-entry holes was drilled as extensions from the bottom of historic MOD drill holes and tested the continuation of mineralization below the existing resource pit shell. Preliminary results suggest the potential to add high-grade resources to the MOD MRE.
At the Roble Target, a discovery campaign of 2,570m over 12 shallow RC holes was completed with broad zones of oxide mineralization encountered from surface, providing additional potential to grow the Company’s oxide resource base.
Highlights
Significant extensions at depth of known copper mineralization at the MOD, complementing previously reported deeper drilling, have potentially positive implications for future scale and mine life of the operation
MAR-17 extended: 488m at 0.48% CuT from 4m including:
New intersection of 284m at 0.63% CuT from 208m, including 126m at 1.13% CuT
MAR-70 extended: 416m at 0.56% CuT from 14m including:
New intersection of 206m at 0.73% CuT from 224m
LAR-06 extended: 332m at 0.66% CuT from 48m including:
New intersection of 52m at 0.78% CuT from 328m
MAR-82 extended: 306m at 0.56% CuT from 4m including:
New intersection of 106m at 0.76% CuT from 204m
MAR-06 extended: 274m at 0.51% CuT from 14m including:
New intersection of 80m at 0.78% CuT from 208m
MAR-55 extended: 252m at 0.40% CuT from 114m including:
New intersection of 64m at 0.59% CuT from 302m
MAR-78 extended: 234m at 1.15% CuT from 108m including:
New intersection of 90m at 0.31% CuT from 252m
MAR-44 extended: 268m at 0.66% CuT from 68m including:
New intersection of 96m at 0.84% CuT from 200m
MAR-80 extended: 228m at 0.69% CuT from 100m including:
New intersection of 60m at 1.07% CuT from 268m
Average leaching potentials1 for all new intersections range from 90.8% to 27.2% with an average of 58.7%
The Company has identified several alternatives to optimize recoveries for materials with lower leaching potentials and will examine these in more detail in the coming months
Full details of extensional holes and leaching potentials in Table 1
At Roble, discovery drilling intersected shallow oxide mineralization extending 600m along and 400m across strike
ROR-03 intersected 62m of 0.34% CuT from 6m including 48m at 0.41% CuT
ROR-01 intersected 10m at 0.58% CuT from 36m within a broader intersection of 138m at 0.12% CuT
ROR-04 intersected 44m at 0.27% CuT from 10m including 18m at 0.41% CuT from 10m
Weak or thinner mineralization was intersected at Roble in ROR-02, as well as at the Nepal and Pele targets, located immediately south of Roble (See Figure 8)
______________________
1 Leaching potential is soluble copper (CuS) plus cyanurable copper (CuCN) divided by total copper (CuT). Intersection average leaching potential is the average of leaching potential calculated per 2 metre section of each reported intersection.
Sergio Rivera, VP Exploration of Marimaca Copper, commented:
“The depth extensions below the MOD continue to highlight the mineralizing system is potentially significantly larger than currently defined and we remain excited about the grades and widths of mineralization over an area extending approximately 400m by 350m with extensions up to nearly 300m downhole.
“Robles also provides another target for follow-up work, complementing the recent discoveries at Cindy and Mercedes, where we continue to target delineating shallow, oxide, resources to form part of the future mine plans in the MOD development. 2021 has been an exceptional year on the exploration front, with all three conceptual exploration targets drilled yielding shallow oxide materials, as well as a significant, higher grade, extensions at depth below the MOD.”
Hayden Locke, President and CEO of Marimaca Copper, commented:
“These drill intersections, when combined with the historical intersections, give a true sense of the potential scale of Marimaca. Given the very strong grades in many extensional intersections and their average leaching potentials, we believe this material could form part of an expanded leachable resource for the MOD. There are several processing combinations to recover the non-leachable portions of this material, and we will examine the technical and economic viability of each to decide the optimum path to copper recovery.
“We have also had exploration success in our surrounding package, with the first three satellite targets – Cindy, Mercedes and Robles – tested and all showing promise for additional, near surface, leachable resources.”
“We believe the depth extensions at the MOD and the success at our satellite targets have the potential to add material additional tonnes to the mine life at Marimaca. We are currently reviewing the results with our metallurgical team before planning further drilling campaigns in addition to the infill drilling to move the inferred resources to higher confidence categories.”
Overview of Drilling Campaign Objectives and Results – MOD Depth Extension Program
The Company completed a 12-hole re-entry program of historic drill holes in the southern portion of the MOD. The depth extension holes were drilled as continuations of historic drill holes at the MOD and were designed to test the continuation of mineralization at depth as follow-up to results from the initial 5-hole extension drilling campaign completed in April 2021 (refer to announcement on 5th of May 2021) including 106m at 0.39% CuT from 500m in MAR-127 Ext and 78m at 0.50% CuT from 310m in MAR-35 Ext.
Holes MAR-17 Ext, 06 Ext, 82 Ext, 55 Ext, 81 Ext, 70 Ext, 44 Ext, 80 Ext, 78 Ext and LAR-06 Ext intersected continuous zones of mixed, enriched and some primary sulphide copper mineralization below the base of the MOD. Sequential copper analysis of all samples is complete with leaching potentials mainly exceeding 50% (refer to Table 1 for further information).
The MOD depth extension drill holes were re-entries of historical holes and commenced at depths ranging from 200m to 300m downhole to new final depths of 450m to 500m. Drilling, noted on the sections below, intersected the down-dip extension of known mineralization into new zones of mixed, enriched and sulphide mineralization. Controlling structures intersected across the northeast and northwest orientated drill holes were generally consistent with the known structural controls at the MOD.
Figure 1: Plan view MOD exploration target and depth extension drill results
https://www.globenewswire.com/NewsRoom/AttachmentNg/39d81276-942a-4a33-b912-ec66111d186e
The majority of these mineralized zones were not captured in the historical MRE (refer to announcement on 2nd of December 2019) used to develop the mine plan for the Preliminary Economic Assessment (“PEA”), which was released in June 2020. MAR-17 Ext, MAR-82 Ext and MAR-06 Ext were drilled in a northwest orientation while MAR-81 Ext, MAR-55 Ext, MAR-44 Ext, MAR-80 Ext, MAR-78 Ext, LAR-06 Ext and MAR-70 Ext were drilled in a northeast orientation.
Figure 2: MOD Depth Extension Program Sections and PEA pit shell – NW-600
https://www.globenewswire.com/NewsRoom/AttachmentNg/bd39ef1c-c0c0-4794-95bf-c5959dd51d2e
Figure 3: MOD Depth Extension Program Sections and PEA pit shell – NW-550
https://www.globenewswire.com/NewsRoom/AttachmentNg/02038ea5-5574-40cc-ac3d-7171d29a70a9
Figure 4: MOD Depth Extension Program and PEA pit shell - Section NW-450
https://www.globenewswire.com/NewsRoom/AttachmentNg/154bbbea-5b19-4df3-a22e-213a70638ca9
Figure 5: MOD Depth Extension Program and PEA pit shell - Section NE-450
https://www.globenewswire.com/NewsRoom/AttachmentNg/b4d99542-d0b2-479c-9ab2-fb5a31b999e9
Figure 6: MOD Depth Extension Program and PEA pit shell - Section NE-100
https://www.globenewswire.com/NewsRoom/AttachmentNg/8d168820-2c6e-4039-a6dd-cf2ef146ad07
Overview of Drilling Campaign Objectives and Results – Roble program
Roble is located less than 3km to the northeast of the MOD, within the northeast trending Roble Fault System. This is a splay off the regional scale Naguayán Fault System, which is an important control for mineralization at the MOD. Previous geophysical, geochemical and reconnaissance work successfully identified and delineated three discrete areas of consistently sub-cropping copper mineralization, each extending over approximately 600m by 400m, separated by gravel and sand cover – Roble, Nepal and Pele (refer to June 29, 2021, announcement).
The 12-hole discovery RC drill program tested initial targets identified in the 2020 and 2021 generative exploration campaign. Results have demonstrated clear potential for the delineation of additional near-surface oxide resources, with shallow, low to moderate-grade mineralization intercepted at the Roble and Nepal targets. The 12 holes were drilled predominantly in a northwest orientation with intercepted mineralization largely controlled by the northeast trending Roble Fault and associated splays.
Figure 7: Roble target area of interest relative to the MOD and other targets
https://www.globenewswire.com/NewsRoom/AttachmentNg/a7e64e93-19e7-4fc7-a8a2-0c28342138d9
Figure 8: Significant intercepts at Nepal and Roble targets
https://www.globenewswire.com/NewsRoom/AttachmentNg/419062bb-ef24-4119-b3dd-b099ca611867
Overview of Leaching Potential
The leaching potential of copper ores is defined as acid soluble copper (CuS) plus cyanurable copper (CuCN) divided by total copper (CuT). The solubility ratio (CuS/CuT) for copper oxides such as atacamite, brochantite and chrysocolla, which dissolve quickly when exposed to acid, is a good predictor of leachability. However, where the mineralization has several copper bearing minerals with different dissolution characteristics under these leaching conditions, the copper acid solubility ratio may materially underestimate the acid leaching potential for heap leach operations, especially where some copper sulphides such as chalcocite, covellite and bornite are present, as these sulphides can be partially dissolved under oxidation conditions.
For this reason, it is common to assay for cyanide soluble copper when assaying leachable copper mineralization. This gives an indication of the total leaching potential [(CuS + CuCN)/CuT] because cyanide dissolves some of the copper sulphides that may be present in the sample and assumes that, during the leaching operation, some oxidation reactions, such as, ferric leaching and/or cupric chloride leaching occur. Due to these reactions during sulphide leaching it can be inferred that copper dissolution in a leaching operation may materially exceed the copper acid solubility ratio identified.
Marimaca has conducted five phases of metallurgical testing and has noted that in several mineral subzones, especially those with higher proportions of black oxides, the metallurgical recovery has exceeded the leaching potentials identified in sequential copper analysis.
Table 1: Summary of MOD Depth Extension Drilling Results
HOLE | New or Historical | From (m) | To (m) | Length | CuT (%) | Mineral Zone Classification | Ave. Leaching |
(%) | |||||||
Mar-06 | Historical + New | 14 | 288 | 274 | 0.51% | Variable | 56.39% |
incl. | Historical | 14 | 196 | 182 | 0.42% | Oxide | 53.71% |
incl. | New (EXT) | 208 | 288 | 80 | 0.78% | Enriched / Mixed / Primary | 63.35% |
incl. | New (EXT) | 210 | 240 | 30 | 1.86% | Enriched / Mixed / Primary | 63.19% |
incl. | New (EXT) | 274 | 288 | 14 | 0.15% | Enriched / Mixed / Primary | 64.27% |
And | New (EXT) | 344 | 368 | 24 | 0.26% | Enriched / Primary | 50.69% |
Mar-17 | Historical + New | 4 | 492 | 488 | 0.48% | Variable | 60.19% |
incl. | Historical | 4 | 194 | 190 | 0.28% | WAD / Oxide | 72.55% |
incl. | New (EXT) | 208 | 492 | 284 | 0.63% | Enriched / Mixed / Primary | 52.67% |
incl. | New (EXT) | 208 | 334 | 126 | 1.13% | Enriched / Mixed / Primary | 52.87% |
incl. | New (EXT) | 238 | 280 | 42 | 1.74% | Enriched / Mixed | 47.85% |
incl. | New (EXT) | 308 | 334 | 26 | 1.83% | Enriched / Mixed / Primary | 38.08% |
incl. | New (EXT) | 352 | 412 | 60 | 0.33% | Enriched / Mixed / Primary | 60.66% |
incl. | New (EXT) | 428 | 462 | 34 | 0.30% | Primary | 37.41% |
incl. | New (EXT) | 482 | 492 | 10 | 0.28% | Primary | 28.89% |
Mar-42 | Historical | 28 | 198 | 170 | 0.43% | Oxide | 71.01% |
incl. | Historical | 104 | 172 | 68 | 0.77% | Oxide | 71.04% |
and | New (EXT) | 292 | 312 | 20 | 0.37% | Enriched | 55.24% |
and | New (EXT) | 342 | 354 | 12 | 0.25% | Enriched / Primary | 41.92% |
Mar-44 | Historical | 16 | 28 | 12 | 0.57% | Oxide | 85.31% |
and | Historical + New | 68 | 336 | 268 | 0.66% | Variable | 79.23% |
incl. | Historical | 102 | 128 | 26 | 0.57% | Oxide / WAD | 88.05% |
incl. | Historical | 150 | 200 | 50 | 1.31% | Oxide / WAD | 89.60% |
incl. | New (EXT) | 200 | 296 | 96 | 0.84% | Oxide / Mixed | 84.17% |
incl. | New (EXT) | 318 | 334 | 16 | 0.32% | Mixed / Enriched | 90.82% |
and | New (EXT) | 400 | 426 | 26 | 0.22% | Primary | 27.99% |
and | New (EXT) | 448 | 468 | 20 | 0.33% | Enriched / Mixed | 85.88% |
Mar-55 | Historical + New | 114 | 366 | 252 | 0.40% | Variable | 43.33% |
incl. | Historical | 110 | 196 | 86 | 0.67% | Oxide / WAD | 47.65% |
incl. | New (EXT) | 260 | 266 | 6 | 0.30% | Enriched | 30.98% |
incl. | New (EXT) | 302 | 366 | 64 | 0.59% | Primary / Enriched / Mixed | 45.48% |
incl. | New (EXT) | 302 | 346 | 44 | 0.80% | Primary / Enriched / Mixed | 38.01% |
incl. | New (EXT) | 354 | 366 | 12 | 0.21% | Enriched | 73.03% |
and | New (EXT) | 396 | 414 | 18 | 0.43% | Enriched / Primary | 36.29% |
and | New (EXT) | 492 | 500 | 8 | 0.57% | Enriched | 61.19% |
Mar-70 | Historical + New | 14 | 430 | 416 | 0.56% | Variable | 61.50% |
incl. | Historical | 42 | 82 | 40 | 0.54% | Oxide | 76.86% |
incl. | Historical | 94 | 196 | 102 | 0.53% | WAD / Oxide | 57.30% |
incl. | New (EXT) | 224 | 430 | 206 | 0.73% | Enriched / Mixed / Primary | 62.65% |
incl. | New (EXT) | 224 | 276 | 52 | 0.88% | Enriched / Mixed | 71.37% |
incl. | New (EXT) | 290 | 356 | 66 | 0.76% | Enriched / Mixed / Primary | 66.55% |
incl. | New (EXT) | 376 | 416 | 40 | 1.27% | Enriched / Mixed | 45.24% |
Mar-78 | Historical + New | 108 | 342 | 234 | 1.15% | Oxide / Enriched | 73.11% |
incl. | Historical | 108 | 250 | 142 | 1.70% | Oxide | 76.51% |
incl. | New (EXT) | 252 | 342 | 90 | 0.31% | Oxide / Enriched | 68.07% |
incl. | New (EXT) | 288 | 304 | 16 | 0.58% | Oxide / Enriched | 81.72% |
and | New (EXT) | 372 | 392 | 20 | 0.25% | WAD / Mixed | 63.39% |
Mar-80 | Historical + New | 100 | 328 | 228 | 0.69% | Variable | 76.15% |
incl. | Historical | 100 | 244 | 144 | 0.63% | Oxide / WAD | 79.66% |
incl. | Historical | 188 | 244 | 56 | 1.21% | Oxide | 86.94% |
incl. | New (EXT) | 268 | 328 | 60 | 1.07% | Enriched / Mixed | 68.45% |
incl. | New (EXT) | 278 | 318 | 40 | 1.52% | Enriched / Mixed | 60.58% |
and | New (EXT) | 396 | 406 | 10 | 0.17% | Oxide / Mixed | 73.35% |
Mar-81 | Historical | 4 | 32 | 28 | 0.31% | Oxide | 66.99% |
and | Historical | 102 | 198 | 96 | 0.42% | Oxide / WAD | 62.47% |
and | New (EXT) | 272 | 284 | 12 | 0.15% | Enriched / Mixed | 66.13% |
and | New (EXT) | 296 | 318 | 22 | 0.16% | Enriched | 68.77% |
and | New (EXT) | 334 | 372 | 38 | 0.73% | Enriched / Mixed | 62.87% |
and | New (EXT) | 394 | 420 | 26 | 0.50% | Oxide / Enriched | 65.16% |
and | New (EXT) | 464 | 484 | 20 | 0.36% | Enriched / Mixed | 82.54% |
Mar-82 | Historical + New | 4 | 310 | 306 | 0.56% | Variable | 56.72% |
incl. | Historical | 4 | 144 | 140 | 0.53% | Oxide / Variable | 80.01% |
incl. | New (EXT) | 204 | 310 | 106 | 0.76% | Enriched / Mixed | 37.74% |
incl. | New (EXT) | 204 | 238 | 34 | 1.19% | Enriched | 33.88% |
incl. | New (EXT) | 274 | 300 | 26 | 0.82% | Mixed / Enriched | 51.49% |
and | New (EXT) | 486 | 496 | 10 | 0.43% | Primary | 39.49% |
ATR-79 | Historical | 6 | 82 | 76 | 0.36% | WAD / Oxide / Mixed | 50.51% |
incl. | Historical | 6 | 46 | 40 | 0.46% | WAD / Oxide | 53.59% |
incl. | Historical | 76 | 82 | 6 | 0.87% | Oxide Mixed | 78.18% |
and | Historical | 122 | 138 | 16 | 1.40% | Primary / Enriched | 18.99% |
and | New (EXT) | 212 | 218 | 6 | 0.25% | Enriched | 85.50% |
and | New (EXT) | 280 | 320 | 40 | 0.12% | Enriched / Mixed | 74.79% |
LAR-06 | Historical + New | 48 | 380 | 332 | 0.66% | Variable | 57.63% |
incl. | Historical | 48 | 300 | 252 | 0.63% | Oxide / WAD / Variable | 60.26% |
incl. | Historical | 70 | 80 | 10 | 0.81% | Oxide | 74.23% |
incl. | Historical | 232 | 300 | 68 | 1.41% | Oxide / Mixed / Enriched | 61.34% |
incl. | New (EXT) | 328 | 380 | 52 | 0.78% | Enriched / Primary | 41.82% |
incl. | New (EXT) | 328 | 340 | 12 | 1.33% | Enriched / Primary | 27.16% |
incl. | New (EXT) | 356 | 380 | 24 | 0.98% | Enriched / Primary | 32.59% |
Table 2: Summary of Roble Drilling Results
HOLE | From (m) | To (m) | Length (m) | CuT (%) |
ROR-01 | 36.00 | 174.00 | 138.00 | 0.12% |
incl. | 36.00 | 46.00 | 10.00 | 0.58% |
incl. | 94.00 | 112.00 | 18.00 | 0.16% |
incl. | 154.00 | 162.00 | 8.00 | 0.18% |
ROR-02 | 60.00 | 74.00 | 14 | 0.12% |
ROR-03 | 6.00 | 68.00 | 62 | 0.34% |
incl. | 20.00 | 68.00 | 48 | 0.41% |
ROR-04 | 10.00 | 54.00 | 44 | 0.27% |
incl. | 10.00 | 28.00 | 18 | 0.41% |
incl. | 36.00 | 54.00 | 18 | 0.23% |
NER-01 | 6.00 | 28.00 | 22 | 0.11% |
and | 78.00 | 102.00 | 24 | 0.16% |
and | 130.00 | 138.00 | 8 | 0.66% |
NER-02 | 12.00 | 60.00 | 48 | 0.10% |
NER-03 | 4.00 | 42.00 | 38 | 0.15% |
incl. | 36.00 | 42.00 | 6 | 0.43% |
NER-04 | 32.00 | 46.00 | 14 | 0.11% |
and | 62.00 | 84.00 | 22 | 0.27% |
and | 230.00 | 246.00 | 16 | 0.17% |
NER-05 | 12.00 | 24.00 | 12 | 0.16% |
and | 60.00 | 66.00 | 6 | 0.11% |
and | 108.00 | 124.00 | 16 | 0.14% |
NER-06 | 36.00 | 88.00 | 52 | 0.15% |
incl. | 36.00 | 52.00 | 16 | 0.24% |
and | 68.00 | 88.00 | 20 | 0.17% |
NER-07 | 50.00 | 92.00 | 42 | 0.17% |
incl. | 56.00 | 68.00 | 12 | 0.32% |
incl. | 82.00 | 92.00 | 10 | 0.25% |
PER-01 | NSI | |||
PER-02 | NSI | |||
PER-03 | NSI |
Appendix: MOD Depth Extension Drill Collars
HOLE | NORTH | EAST | AZIMUTH | DIP | DEPTH (m) | EXTENSION (m) | FINAL DEPTH (m) |
MAR-06 | 7,435,594.69 | 375,073.54 | 310 | -60 | 200 | 300 | 500 |
MAR-17 | 7,435,519.50 | 374,925.22 | 310 | -55 | 200 | 300 | 500 |
MAR-42 | 7,435,517.23 | 374,995.62 | 310 | -55 | 200 | 250 | 450 |
MAR-44 | 7,435,575.48 | 374,938.62 | 220 | -55 | 200 | 300 | 500 |
MAR-55 | 7,435,510.84 | 375,080.94 | 220 | -60 | 200 | 300 | 500 |
MAR-70 | 7,435,586.30 | 375,006.67 | 220 | -60 | 220 | 280 | 500 |
MAR-78 | 7,435,649.19 | 374,848.34 | 220 | -60 | 250 | 190 | 440 |
MAR-80 | 7,435,616.80 | 374,885.25 | 220 | -60 | 250 | 190 | 440 |
MAR-81 | 7,435,560.60 | 375,046.33 | 220 | -60 | 200 | 300 | 500 |
MAR-82 | 7,435,563.46 | 375,041.94 | 310 | -60 | 200 | 300 | 500 |
ATR-79 | 7,435,738.01 | 375,045.31 | 310 | -60 | 200 | 300 | 500 |
LAR-06 | 7,435,754.31 | 374,805.22 | 220 | -60 | 300 | 150 | 450 |
Appendix: Roble Drill Collars
HOLE | NORTH | EAST | AZIMUTH | DIP | DEPTH (m) |
ROR-01 | 7,438,515.26 | 377,501.37 | 310 | -55 | 220 |
ROR-02 | 7,438,255.56 | 377,377.36 | 310 | -55 | 200 |
ROR-03 | 7,438,409.21 | 377,374.48 | 310 | -60 | 200 |
ROR-04 | 7,438,784.13 | 377,421.27 | 310 | -60 | 150 |
NER-01 | 7,437,970.05 | 377,438.65 | 270 | -60 | 220 |
NER-02 | 7,437,809.53 | 377,352.83 | 310 | -55 | 200 |
NER-03 | 7,437,710.83 | 377,351.49 | 310 | -55 | 200 |
NER-04 | 7,437,805.69 | 377,516.58 | 310 | -55 | 250 |
NER-05 | 7,437,725.63 | 377,459.86 | 310 | -55 | 230 |
NER-06 | 7,437,556.14 | 377,369.32 | 270 | -55 | 200 |
NER-07 | 7,437,593.49 | 377,427.60 | 310 | -55 | 200 |
PER-01 | 7,436,814.87 | 377,071.64 | 310 | -60 | 150 |
PER-02 | 7,436,821.06 | 376,970.31 | 310 | -60 | 150 |
PER-03 | 7,437,059.53 | 377,195.74 | 310 | -60 | 200 |
Sampling and Assay Protocol
True widths cannot be determined with the information available at this time. RC holes were sampled on a 2m continuous basis, with dry samples riffle split on site and one quarter sent to the Andes Analytical Assay preparation laboratory in Calama and the pulps then sent to the same company laboratory in Santiago for assaying. A second quarter was stored on site for reference. Samples were prepared using the following standard protocol: drying; crushing to better than 85% passing -10#; homogenizing; splitting; pulverizing a 500-700g subsample to 95% passing -150#; and a 125g split of this sent for assaying. All samples were assayed for %CuT (total copper) and %CuS (acid soluble copper) by AAS. A full QA/QC program, involving insertion of appropriate blanks, standards and duplicates was employed with acceptable results. Pulps and sample rejects are stored by Marimaca Copper for future reference.
Qualified Person
The technical information in this news release, including the information that relates to geology, drilling and mineralization was prepared under the supervision of, or has been reviewed by Sergio Rivera, Vice President of Exploration, Marimaca Copper Corp, a geologist with more than 36 years of experience and a member of the Colegio de Geólogos de Chile and of the Institute of Mining Engineers of Chile, and who is the Qualified Person for the purposes of NI 43-101 responsible for the design and execution of the drilling program.
The QP confirms he has visited the project area, has reviewed relevant project information, is responsible for the information contained in this news release, and consents to its publication.
Contact Information
For further information please visit www.marimaca.com or contact:
Tavistock
+44 (0) 207 920 3150
Jos Simson/Oliver Lamb/Nick Elwes
marimaca@tavistock.co.uk
Forward Looking Statements
This news release includes certain “forward-looking statements” under applicable Canadian securities legislation. There can be no assurance that such statements will prove to be accurate, and actual results and future events could differ materially from those anticipated in such statements. Forward-looking statements reflect the beliefs, opinions and projections on the date the statements are made and are based upon a number of assumptions and estimates that, while considered reasonable by Marimaca Copper, are inherently subject to significant business, economic, competitive, political and social uncertainties and contingencies. Many factors, both known and unknown, could cause actual results, performance or achievements to be materially different from the results, performance or achievements that are or may be expressed or implied by such forward-looking statements and the parties have made assumptions and estimates based on or related to many of these factors. Such factors include, without limitation: risks related to share price and market conditions, the inherent risks involved in the mining, exploration and development of mineral properties, the uncertainties involved in interpreting drilling results and other geological data, fluctuating metal prices, the possibility of project delays or cost overruns or unanticipated excessive operating costs and expenses, uncertainties related to the necessity of financing, the availability of and costs of financing needed in the future as well as those factors disclosed in the annual information form of the Company dated March 29, 2021, the final short form base prospectus and other filings made by the Company with the Canadian securities regulatory authorities (which may be viewed at www.sedar.com). Accordingly, readers should not place undue reliance on forward-looking statements. Marimaca Copper undertakes no obligation to update publicly or otherwise revise any forward-looking statements contained herein whether as a result of new information or future events or otherwise, except as may be required by law.
Neither the Toronto Stock Exchange nor the Investment Industry Regulatory Organization of Canada accepts responsibility for the adequacy or accuracy of this release.

