
Market Outlook: 3 Lesser-Known Indicators Point to a Decline in the Next Week
The latest chapter in the European sovereign debt crisis and a Fed meeting failed to move stocks last week. After a very strong run-up, it looks like the widely expected pullback could be near. Until there are significant changes in long-term indicators, expect any pullback to be brief.
Stocks Finally Flash a Warning Sign
Stocks have been soaring this year, but the strong uptrend paused last week and SPDR S&P 500 (SPY) lost 0.15%. That does not necessarily mark the end of the trend, but I do expect a consolidation or small decline in the next week or so.
Longer term, over the next three months, I believe stocks will rise. But for the short term, we have a warning sign in the parabolic SAR indicator, shown as dotted lines above and below the candlesticks in the chart below.
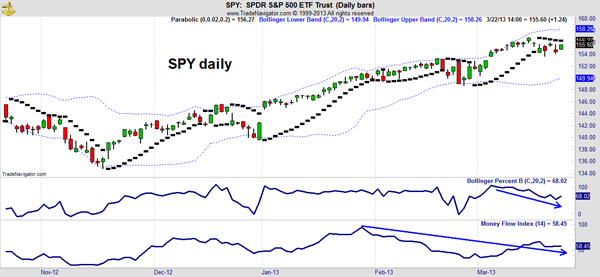
The parabolic indicator was developed as a "stop and reverse" (SAR) system. It is designed to move closer to the price action as a trend develops. In back testing, the indicator is marginally profitable for short trades in SPY. On long trades, it beats buy-and-hold and reduces the worst loss.
On March 18, the SAR switched from long to short. That is not a strong enough signal to enter a short trade, just a reason to hold off on any new buys. We also have small divergences in the Bollinger PercentB and the Money Flow Index.
Admittedly, these three indicators are not the most popular ones. In the past, when divergences like this develop and the parabolic is bearish, SPY has fallen 53% of the time in the week after this trade setup occurs. Markets have a bullish bias, rising 57% of the time, so this setup is a fairly significant edge favoring the bears this week.
Recommended Trade Setup:
-- Maintain long position in SPY, but do not make new purchases
-- Tighten stop-loss to $149
-- Look for a close above $156.27 before becoming bullish again
Gold Enjoys a Brief Rally as Euro Zone Crisis Simmers
SPDR Gold Trust (GLD) gained 1.01% last week after gapping up on Monday in response to the news from Cyprus. There wasn't any follow-through on Monday's gain and gold actually slid lower as the week went on.
It seems like gold should have had a better week. Cyprus announced a plan to confiscate wealth with a tax on bank accounts -- exactly the scenario the gold bugs have long warned about. Officials seemed to backtrack on their plans in response to the unpopularity and no one knows for sure when Cypriot banks will reopen or what the account balances will be when accounts are accessed. In a word, the situation could be called "uncertain."
Even without the news, I had been looking for a small gain in gold as I detailed last week. In the short term, expect a small rally in GLD, and after that, watch for the bear market in gold to accelerate.
The daily chart shows that prices ran into resistance at the upper Bollinger Band as momentum peaked, shown with a bearish crossover in the stochastics indicator.

I recommend continuing to hold PowerShares DB Gold Short ETN (DGZ), an inverse fund that goes up when gold prices fall, even though DGZ fell 1.21% last week.
Recommended Trade Setup:
-- Buy DGZ on dips below $12.25
-- Maintain stop-loss at $11.75
-- Maintain price target at $14
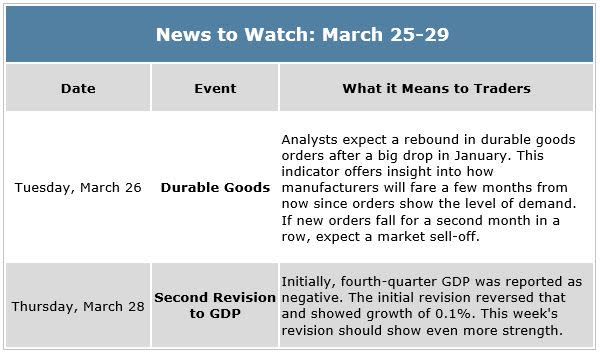
This Week's News
The housing recovery is now accepted as a fact by most economists after positive reports on home construction and sales activity were released last week.
With no major earnings announcements scheduled, traders will have plenty of time to watch for news from Europe. Cyprus is expected to remain the focus of the bailout for at least this week.
Related Articles
Caution: If You're Planning to Buy Stocks at All-Time Highs, Read This First
Candy Maker's Breakout Could Score Traders Another Double-Digit Win
