Market Valuations and Expected Returns - April 3, 2014
In January 2014, the stock market benchmark S&P 500 lost 3.36% after the excellent 2013. The enthusiasm went back as the market gained 4.31% over February. In March, it went up only 0.69%. The market benchmark S&P 500 closed at 1890.90 on April 2, 2014, which is the new record high. Despite the market hit new highs continuously, there are signs that the economy might slow down.
As investors are happier with the higher balances in their account, they should never forget the word "RISK," which is directly linked to the valuations of the assets they own. A higher current valuation always implies a lower future returns.
Seth Klarman has returned $4 billion to clients at 2013 year-end due to lack of ideas and has 40% of the portfolio in cash. In his 2013 letter to investors, he wrote:
"Any year in which the S&P 500 jumps 32 percent and the Nasdaq 40 percent while corporate earnings barely increase should be a cause for concern. Fiscal stimulus, in the form of sizable deficits, has propped up the consumer, thereby inflating corporate revenues and earnings. But what is the right multiple to pay on juiced corporate earnings? Pretty clearly, lower than otherwise. Yet Robert Schiller's cyclically adjusted P/E valuation is over 25, a level exceeded only three times before - prior to the 1929, 2000 and 2007 market crashes. Indeed, on almost any metric, the U.S. equity market is historically quite expensive. A skeptic would have to be blind not to see bubbles inflating in junk bond issuance, credit quality, and yields, not to mention the nosebleed stock market valuations of fashionable companies like Netflix and Tesla Motors. The overall picture is one of growing risk and inadequate potential return almost everywhere one looks. Someday, financial markets will again decline. Someday, rising stock and bond markets will no longer be government policy - maybe not today or tomorrow, but someday. Someday, QE will end and money won't be free. Someday, corporate failure will be permitted. Someday, the economy will turn down again, and someday, somewhere, somehow, investors will lose money and once again come to favor capital preservation over speculation. Someday, interest rates will be higher, bond prices lower, and the prospective return from owning fixed-income instruments will again be roughly commensurate with the risk. Someday, professional investors will come to work and fear will have come to the markets and that fear will spread like wildfire. The news flow will be bad, and the markets will be tumbling."
Jeremy Grantham, the legendary money manger of GMO, said in an interview with Barron's on March 15, 2014, "Stocks are certainly overvalued," but he would not say there is a bubble. He pointed out that there were two good standards for determining whether a bubble exists. On the statistical front, the S&P 500 is now trading at around 1860. This is between one and two standard deviations outside the normal distribution of stock-valuation levels. "A two-sigma event would put the index at 2,350. So the market would have to go up another 30% to get to bubble territory," he said. On the euphoria test, Grantham said he likes to joke that in 2000, Boston diners replaced replays of Celtics games with stock-market talking heads. "But I've noticed recently that they are still playing the sports highlights on the televisions in the pubs here," he said. Grantham added that stocks are 65% overpriced: "If they go up another 30%, you would have a true bubble, at which point stocks would be close to twice their fair value." In 2000, stocks were more than double fair value, he said.
In 2014, Wall Street has lowered the expectation of the market. Especially after the Fed announced to "taper" its bond purchases, most investors and traders either become bearish or more cautious to bullish the future stock market.
In John Hussman's commentary on March 24, 2014, he said, "Fed-Induced Speculation Does Not Create Wealth. We presently estimate 10-year nominal total returns for the S&P 500 Index averaging just 2.3% annually. Moreover, our current estimates of prospective S&P 500 total returns are negative on every horizon shorter than about seven years. Meanwhile, corporate bond yields and spreads are near record lows, Treasury bill yields are near zero, and the 10-year Treasury bond yield is just over 2.7%. Our friend James Montier at GMO correctly calls this a "hideous opportunity set... In our view, the appropriate response is not to attempt to squeeze water from a stone, but to wait for the rain."
In A CAPE Crusader ? A Defence Against the Dark Arts, GMO's James Montier said: "As a general rule we average across the various models we use to generate our best forecast as to where real returns are likely to head, rather than relying upon one signal model (without exceptionally good reason). Doing so currently results in our expectation of a -1.1% real return for the S&P 500 over the next seven years. We continue to believe that the weight of valuation evidence suggests the S&P 500 is significantly overvalued at its current levels. Some call us 'valuation bears'; we argue that we are simply valuation realists!"
According to our last market valuation article, the Buffett Indicator and Shiller P/E Both Imply Long Term Negative Market Returns. Regarding our 2014 Market Valuation, the good news is that our account balance is higher and investors are more bullish. The bad news is that we will see lower future returns.
GuruFocus hosts three pages about market valuations. The first is the market valuation based on the ratio of total market cap over GDP; the second is the measurement of the U.S. market valuation based on the Shiller P/E. These pages are for the U.S. market. We have also created a new page for international markets. You can check it out here. All pages are updated at least daily. Monthly data is displayed for the international market.
Why Is This Important?
As pointed out by Warren Buffett, the percentage of total market cap (TMC) relative to the U.S. GNP is "probably the best single measure of where valuations stand at any given moment."
Knowing the overall market valuation and the expected market returns will give investors a clearer head on where we stand for future market returns. When the overall market is expensive and positioned for poor returns, the overall market risk is high. It is important for investors to be aware of this and take consideration of this in their asset allocation and investing strategies.
Please keep in mind that the long-term valuations published here do not predict short-term market movement. But they have done a good job predicting the long-term market returns and risks.
Why Did We Develop These Pages?
We developed these pages because of the lessons we learned over the years of value investing. From the market crashes in 2001 to 2002 and 2008 to 2009, we learned that value investors should also keep an eye on overall market valuation. Many times value investors tend to find cheaper stocks in any market. But a lot of times the stocks they found are just cheaper, instead of cheap. Keeping an eye on the overall market valuation will help us to focus on absolute value instead of relative value.
The indicators we develop focus on the long term. They will provide a more objective view on the market.
Ratio of Total Market Cap over GDP - Market Valuation and Implied Returns
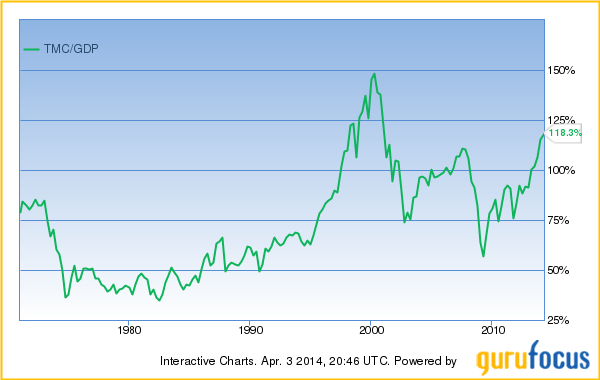
The information about the market valuation and the implied return based on the ratio of the total market cap over GDP is updated daily. As of April 3, 2014, the total market cap as measured by Wilshire 5000 index is 118.3% of the US GDP. We can see the equity values as the percentage of GDP are near their peaks. The only time they were higher was at the apex of the dot com bubble. The stock market is likely to return about 1.5% a year in the coming years. The Stock Market is Significantly Overvalued. As a comparison, at the beginning of 2013, the ratio of total market cap over GDP was 97.5%, and it was likely to return 4% a year from that level of valuation.
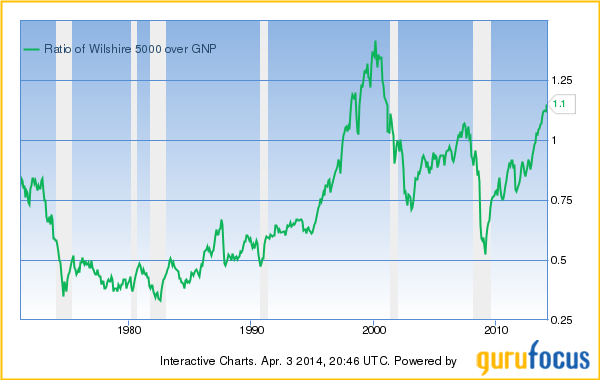
A quick refresher (thanks to Greenbacked): GDP is "the total market value of goods and services produced within the borders of a country." GNP is "the total market value of goods and services produced by the residents of a country, even if they're living abroad. So if a U.S. resident earns money from an investment overseas, that value would be included in GNP (but not GDP)."
For details, please go to the daily updated page. In general, the returns of investing in an individual stock or in the entire stock market are determined by these three factors:
1. Business Growth
If we look at a particular business, the value of the business is determined by how much money this business can make. The growth in the value of the business comes from the growth of the earnings of the business growth. This growth in the business value is reflected as the price appreciation of the company's stock if the market recognizes the value, which it does, eventually.
If we look at the overall economy, the growth in the value of the entire stock market comes from the growth of corporate earnings. As we discussed above, over the long term, corporate earnings grow as fast as the economy itself.
2. Dividends
Dividends are an important portion of the investment return. Dividends come from the cash earning of a business. Everything equal, a higher dividend payout ratio, in principle, should result in a lower growth rate. Therefore, if a company pays out dividends while still growing earnings, the dividend is an additional return for the shareholders besides the appreciation of the business value.
3. Change in the Market Valuation
Although the value of a business does not change overnight, its stock price often does. The market valuation is usually measured by the well-known ratios such as P/E, P/S, P/B, etc. These ratios can be applied to individual businesses, as well as the overall market. The ratio Warren Buffett uses for market valuation, TMC/GNP, is equivalent to the P/S ratio of the economy.
Putting all the three factors together, the return of an investment can be estimated by the following formula:
Investment Return (%) = Dividend Yield (%)+ Business Growth (%)+ Change of Valuation (%)
From the contributions we can get the predicted return of the market.
The Predicted and the Actual Stock Market Returns
This model has done a decent job in predicting the future market returns. You can see the predicted return and the actual return in the chart below.

The prediction from this approach is never an exact number. The return can be as high as 6.5% a year or as low as -6.4% a year, depending where the future market valuation will be. In general, investors need to be cautious when the expected return is low.
Shiller P/E - Market Valuation and Implied Returns
The GuruFocus Shiller P/E page indicates that the Shiller P/E is 25.8. This is 56.4% higher than the historical mean of 16.5. Implied future annual return is 0.9%. The historical low for Shiller P/E is 4.8, while the historical high is 44.2.
The Shiller P/E chart is shown below:

Over the last decade, the Shiller P/E indicated that the best time to buy stocks was March 2009. However, the regular P/E was at its highest level ever. The Shiller P/E, similar to the ratio of the total market cap over GDP, has proven to be a better indication of market valuations.
Overall, the current market valuation is more expensive than the most part of the last 130 years. It is cheaper than most of the time over the last 15 years.
To understand more, please go to GuruFocus' Shiller P/E page.
John Hussman's Peak P/E:
John Hussman presently estimates prospective 10-year S&P 500 nominal total returns averaging just 2.3% annually, with negative expected total returns on every horizon shorter than 7 years.
In John Hussman's commentary on March 24, 2014, "Fed-Induced Speculation Does Not Create Wealth," he said "Based on valuation methods that have maintained a near 90% correlation with actual subsequent market returns not only historically but also in recent decades, we presently estimate 10-year nominal total returns for the S&P 500 Index averaging just 2.3% annually. It is worth remembering that these same methods indicated the likelihood of 10-year S&P 500 total returns averaging 10-12% annually in late-2008 and early-2009 (our 2009 insistence on stress-testing against Depression-era data was not based on valuation concerns). Moreover, our current estimates of prospective S&P 500 total returns are negative on every horizon shorter than about seven years. Meanwhile, corporate bond yields and spreads are near record lows, Treasury bill yields are near zero, and the 10-year Treasury bond yield is just over 2.7%. Our friend James Montier at GMO correctly calls this a 'hideous opportunity set.'"
"In our view, the appropriate response is not to attempt to squeeze water from a stone, but to wait for the rain. This approach requires investors to have a tolerance for portfolio returns that may not track the market should the present speculative episode run further. For investors with no tolerance for tracking risk, there is not much that can be done except to ensure that your portfolio is not more aggressive than your tolerance for loss. Those estimates of potential loss should be based not on the shallow corrections of the uncompleted half-cycle since 2009, but on the experience of 2000-2002 and 2007-2009."
In John Hussman's commentary on March 3, 2014, "Do Foreign Profits Explain Elevated Profit Margins? No.," he said, "On a valuation basis, stocks are far more overvalued than they were in October 1987, and less overvalued than they were in 2000, but both points warranted a strongly defensive stance because of the syndrome of conditions that emerged."
In all the three approaches discussed above, the fluctuations of profit margin are eliminated by using GDP, the average of trailing 10-year inflation-adjusted earnings, and peak-P/E, revenue or book value, etc. Therefore they arrive at similar conclusions: The market is overvalued, and it is likely to return only 0.9% to 2.3% annually in the future years.
Jeremy Grantham's 7-Year Projection:
In A CAPE Crusader ? A Defence Against the Dark Arts, James Montier said, "We continue to believe that the weight of valuation evidence suggests the S&P 500 is significantly overvalued at its current levels. Some call us 'valuation bears;' we argue that we are simply valuation realists!"
As of Feb. 28, 2014, GMO's 7-year forecast is below:
Stocks | |||
US Large | -1.6% | Intl Large | 1.0% |
US Small | -5.1% | Intl Small | -0.1% |
US High Quality | 2.1% | Emerging | 4.1% |
Bonds | |||
US Bonds | 0.4% | Inflation Linked Bonds | 0.6% |
Intl Bonds Hedged | -2.3% | Cash | -0.4% |
Emerging Debt | 2.7% | ||
Other | |||
Timber | 5.9% |
Source:
https://www.gmo.com/America/CMSAttachmentDownload.aspx?target=JUBRxi51IIDZrv0FZiZbpIB3l3m%2fhybvfBpUIeImpq8f72rdLvXx7f3CjhzC9Q%2bpmRQspgkX63FM7bVF3Dp6phYxicYC3kOpmUyxo6d05eU%3d
GMO expected U.S. large cap real return to be -1.6%. This number does not agree with what we find out with market/GDP ratio and Shiller P/E ratio. The U.S. high quality's return is expected to be 2.1% a year.
Insider Trends
As indicated by the three different approaches discussed above, the best buying opportunities over the last five years appeared when the projected returns were at their highest level from October 2008 to April 2009, when investors could expect 10% a year from the U.S. market.
If average investors missed this opportunity, corporate insiders such as CEOs, CFOs and directors did not. As a whole they purchased their own company shares at more than double the normal rate from October 2008 to April 2009. Many of these purchases resulted in multi-bagger gains. This confirmed again the conclusions of earlier studies: The aggregated activities of insiders can serve as a good indicator for locating the market bottoms. Insiders as a whole are smart investors of their own companies. They tend to sell more when the market is high, and buy more when the market is low.
This is the current insider trend for S&P 500 companies:

The latest trends of insider buying are updated daily at GuruFocus' Insider Trend page. Data is updated hourly on this page. The insider trends of different sectors are also displayed in this page. The latest insider buying peak is at this page: September of 2011, when the market was at recent lows.
Conclusion: The stock market is not cheap as measured by long term valuation ratios. It is positioned for about 0.9% to 2.3% of annual returns for the next decade. By watching the overall market valuations and the insider buying trends investors will have a better understanding of the risk and the opportunities. The best time to buy is when the market valuation is low, and insiders are enthusiastic about their own company's stocks.
Investment Strategies at Different Market Levels
The Shiller P/E and the ratio of total market cap over GDP can serve as good guidance for investors in deciding their investment strategies at different market valuations. Historical market returns prove that when the market is fair or overvalued, it pays to be defensive. Companies with high quality business and strong balance sheet will provide better returns in this environment. When the market is cheap, beaten down companies with strong balance sheets can provide outsized returns.
To Summarize:
1. When the market is fair valued or overvalued, buy high-quality companies such as those in the Buffett-Munger Screener.
2. When the market is undervalued, buy low-risk beaten-down companies like those in the Ben Graham Net-Net Screener. Buy a basket of them and be diversified.
3. If market is way over valued, stay in cash. You may consider hedging or short.
If you are not a Premium Member, we invite you for a 7-day Free Trial .
This article first appeared on GuruFocus.
