Are Mastermyne Group Limited’s (ASX:MYE) High Returns Really That Great?

Today we'll evaluate Mastermyne Group Limited (ASX:MYE) to determine whether it could have potential as an investment idea. Specifically, we'll consider its Return On Capital Employed (ROCE), since that will give us an insight into how efficiently the business can generate profits from the capital it requires.
First, we'll go over how we calculate ROCE. Second, we'll look at its ROCE compared to similar companies. And finally, we'll look at how its current liabilities are impacting its ROCE.
Understanding Return On Capital Employed (ROCE)
ROCE measures the 'return' (pre-tax profit) a company generates from capital employed in its business. All else being equal, a better business will have a higher ROCE. Overall, it is a valuable metric that has its flaws. Renowned investment researcher Michael Mauboussin has suggested that a high ROCE can indicate that 'one dollar invested in the company generates value of more than one dollar'.
How Do You Calculate Return On Capital Employed?
Analysts use this formula to calculate return on capital employed:
Return on Capital Employed = Earnings Before Interest and Tax (EBIT) ÷ (Total Assets - Current Liabilities)
Or for Mastermyne Group:
0.18 = AU$12m ÷ (AU$92m - AU$27m) (Based on the trailing twelve months to June 2019.)
So, Mastermyne Group has an ROCE of 18%.
View our latest analysis for Mastermyne Group
Is Mastermyne Group's ROCE Good?
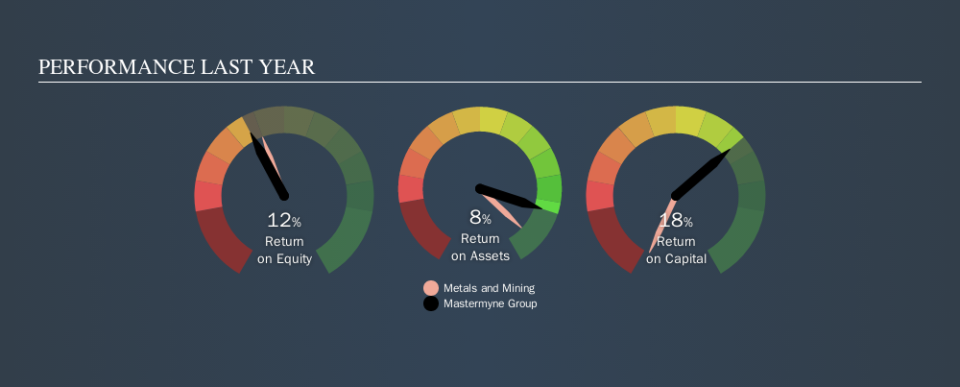
One way to assess ROCE is to compare similar companies. Using our data, we find that Mastermyne Group's ROCE is meaningfully better than the 8.0% average in the Metals and Mining industry. I think that's good to see, since it implies the company is better than other companies at making the most of its capital. Independently of how Mastermyne Group compares to its industry, its ROCE in absolute terms appears decent, and the company may be worthy of closer investigation.
Mastermyne Group delivered an ROCE of 18%, which is better than 3 years ago, as was making losses back then. That implies the business has been improving. The image below shows how Mastermyne Group's ROCE compares to its industry, and you can click it to see more detail on its past growth.
It is important to remember that ROCE shows past performance, and is not necessarily predictive. ROCE can be deceptive for cyclical businesses, as returns can look incredible in boom times, and terribly low in downturns. ROCE is only a point-in-time measure. Given the industry it operates in, Mastermyne Group could be considered cyclical. What happens in the future is pretty important for investors, so we have prepared a free report on analyst forecasts for Mastermyne Group.
How Mastermyne Group's Current Liabilities Impact Its ROCE
Liabilities, such as supplier bills and bank overdrafts, are referred to as current liabilities if they need to be paid within 12 months. Due to the way ROCE is calculated, a high level of current liabilities makes a company look as though it has less capital employed, and thus can (sometimes unfairly) boost the ROCE. To counteract this, we check if a company has high current liabilities, relative to its total assets.
Mastermyne Group has total liabilities of AU$27m and total assets of AU$92m. Therefore its current liabilities are equivalent to approximately 30% of its total assets. Low current liabilities are not boosting the ROCE too much.
Our Take On Mastermyne Group's ROCE
Overall, Mastermyne Group has a decent ROCE and could be worthy of further research. Mastermyne Group shapes up well under this analysis, but it is far from the only business delivering excellent numbers . You might also want to check this free collection of companies delivering excellent earnings growth.
If you are like me, then you will not want to miss this free list of growing companies that insiders are buying.
We aim to bring you long-term focused research analysis driven by fundamental data. Note that our analysis may not factor in the latest price-sensitive company announcements or qualitative material.
If you spot an error that warrants correction, please contact the editor at editorial-team@simplywallst.com. This article by Simply Wall St is general in nature. It does not constitute a recommendation to buy or sell any stock, and does not take account of your objectives, or your financial situation. Simply Wall St has no position in the stocks mentioned. Thank you for reading.
