Matthews International Corporation (NASDAQ:MATW): Can It Deliver A Superior ROE To The Industry?

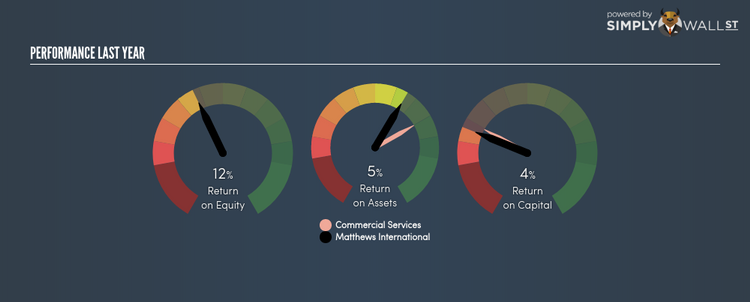
Matthews International Corporation (NASDAQ:MATW) generated a below-average return on equity of 11.91% in the past 12 months, while its industry returned 12.04%. MATW’s results could indicate a relatively inefficient operation to its peers, and while this may be the case, it is important to understand what ROE is made up of and how it should be interpreted. Knowing these components could change your view on MATW’s performance. Today I will look at how components such as financial leverage can influence ROE which may impact the sustainability of MATW’s returns. See our latest analysis for Matthews International
What you must know about ROE
Return on Equity (ROE) weighs Matthews International’s profit against the level of its shareholders’ equity. It essentially shows how much the company can generate in earnings given the amount of equity it has raised. In most cases, a higher ROE is preferred; however, there are many other factors we must consider prior to making any investment decisions.
Return on Equity = Net Profit ÷ Shareholders Equity
Returns are usually compared to costs to measure the efficiency of capital. Matthews International’s cost of equity is 10.00%. Some of Matthews International’s peers may have a higher ROE but its cost of equity could exceed this return, leading to an unsustainable negative discrepancy i.e. the company spends more than it earns. This is not the case for Matthews International which is reassuring. ROE can be split up into three useful ratios: net profit margin, asset turnover, and financial leverage. This is called the Dupont Formula:
Dupont Formula
ROE = profit margin × asset turnover × financial leverage
ROE = (annual net profit ÷ sales) × (sales ÷ assets) × (assets ÷ shareholders’ equity)
ROE = annual net profit ÷ shareholders’ equity
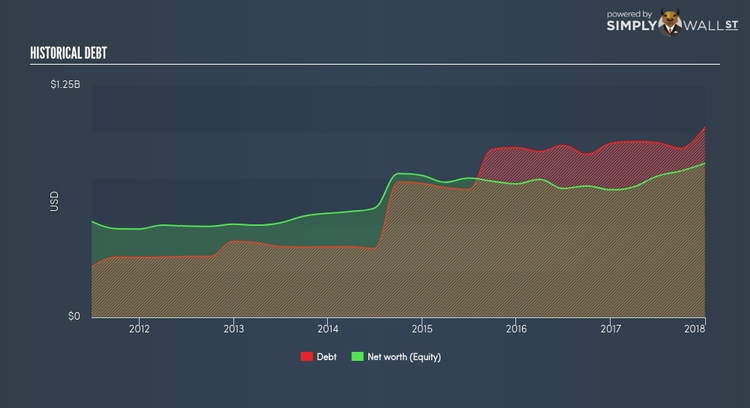
Basically, profit margin measures how much of revenue trickles down into earnings which illustrates how efficient the business is with its cost management. Asset turnover shows how much revenue Matthews International can generate with its current asset base. And finally, financial leverage is simply how much of assets are funded by equity, which exhibits how sustainable the company’s capital structure is. Since financial leverage can artificially inflate ROE, we need to look at how much debt Matthews International currently has. Currently the debt-to-equity ratio stands at a balanced 123.48%, which means its ROE is driven by its ability to grow its profit without a significant debt burden.
Next Steps:
While ROE is a relatively simple calculation, it can be broken down into different ratios, each telling a different story about the strengths and weaknesses of a company. Even though Matthews International returned below the industry average, its ROE comes in excess of its cost of equity. Its appropriate level of leverage means investors can be more confident in the sustainability of Matthews International’s return with a possible increase should the company decide to increase its debt levels. Although ROE can be a useful metric, it is only a small part of diligent research.
For Matthews International, I’ve put together three key aspects you should further research:
Financial Health: Does it have a healthy balance sheet? Take a look at our free balance sheet analysis with six simple checks on key factors like leverage and risk.
Valuation: What is Matthews International worth today? Is the stock undervalued, even when its growth outlook is factored into its intrinsic value? The intrinsic value infographic in our free research report helps visualize whether Matthews International is currently mispriced by the market.
Other High-Growth Alternatives : Are there other high-growth stocks you could be holding instead of Matthews International? Explore our interactive list of stocks with large growth potential to get an idea of what else is out there you may be missing!
To help readers see pass the short term volatility of the financial market, we aim to bring you a long-term focused research analysis purely driven by fundamental data. Note that our analysis does not factor in the latest price sensitive company announcements.
The author is an independent contributor and at the time of publication had no position in the stocks mentioned.
