How MCAN Mortgage Corporation (TSX:MKP) Delivered A Better ROE Than Its Industry

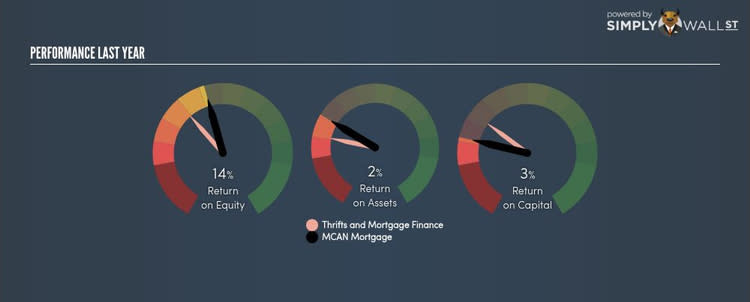
With an ROE of 13.50%, MCAN Mortgage Corporation (TSX:MKP) outpaced its own industry which delivered a less exciting 9.38% over the past year. On the surface, this looks fantastic since we know that MKP has made large profits from little equity capital; however, ROE doesn’t tell us if management have borrowed heavily to make this happen. In this article, we’ll closely examine some factors like financial leverage to evaluate the sustainability of MKP’s ROE. See our latest analysis for MKP
What you must know about ROE
Firstly, Return on Equity, or ROE, is simply the percentage of last years’ earning against the book value of shareholders’ equity. For example, if MKP invests CA$1 in the form of equity, it will generate CA$0.14 in earnings from this. In most cases, a higher ROE is preferred; however, there are many other factors we must consider prior to making any investment decisions.
Return on Equity = Net Profit ÷ Shareholders Equity
ROE is measured against cost of equity in order to determine the efficiency of MKP’s equity capital deployed. Its cost of equity is 11.30%. Since MKP’s return covers its cost in excess of 2.21%, its use of equity capital is efficient and likely to be sustainable. Simply put, MKP pays less for its capital than what it generates in return. ROE can be split up into three useful ratios: net profit margin, asset turnover, and financial leverage. This is called the Dupont Formula:
Dupont Formula
ROE = profit margin × asset turnover × financial leverage
ROE = (annual net profit ÷ sales) × (sales ÷ assets) × (assets ÷ shareholders’ equity)
ROE = annual net profit ÷ shareholders’ equity
Basically, profit margin measures how much of revenue trickles down into earnings which illustrates how efficient MKP is with its cost management. Asset turnover reveals how much revenue can be generated from MKP’s asset base. Finally, financial leverage will be our main focus today. It shows how much of assets are funded by equity and can show how sustainable MKP’s capital structure is. Since ROE can be inflated by excessive debt, we need to examine MKP’s debt-to-equity level. At over 2.5 times, MKP’s debt-to-equity ratio is very high and indicates the above-average ROE is generated by significant leverage levels.

What this means for you:
Are you a shareholder? MKP exhibits a strong ROE against its peers, as well as sufficient returns to cover its cost of equity. However, with debt capital in excess of equity, ROE might be inflated by the use of debt funding, which is something you should be aware of before buying more MKP shares. If you’re looking for new ideas for high-returning stocks, you should take a look at our free platform to see the list of stocks with Return on Equity over 20%.
Are you a potential investor? If you are considering investing in MKP, looking at ROE on its own is not enough to make a well-informed decision. I recommend you do additional fundamental analysis by looking through our most recent infographic report on MCAN Mortgage to help you make a more informed investment decision.
To help readers see pass the short term volatility of the financial market, we aim to bring you a long-term focused research analysis purely driven by fundamental data. Note that our analysis does not factor in the latest price sensitive company announcements.
The author is an independent contributor and at the time of publication had no position in the stocks mentioned.
