Will Medpace Holdings Inc (undefined:MEDP) Continue To Underperform Its Industry?

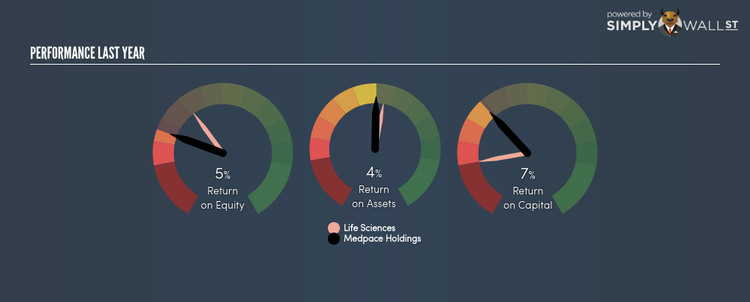
Medpace Holdings Inc (NASDAQ:MEDP) generated a below-average return on equity of 4.79% in the past 12 months, while its industry returned 10.18%. An investor may attribute an inferior ROE to a relatively inefficient performance, and whilst this can often be the case, knowing the nuts and bolts of the ROE calculation may change that perspective and give you a deeper insight into MEDP’s past performance. Today I will look at how components such as financial leverage can influence ROE which may impact the sustainability of MEDP’s returns. Check out our latest analysis for Medpace Holdings
Peeling the layers of ROE – trisecting a company’s profitability
Firstly, Return on Equity, or ROE, is simply the percentage of last years’ earning against the book value of shareholders’ equity. An ROE of 4.79% implies $0.05 returned on every $1 invested. In most cases, a higher ROE is preferred; however, there are many other factors we must consider prior to making any investment decisions.
Return on Equity = Net Profit ÷ Shareholders Equity
ROE is assessed against cost of equity, which is measured using the Capital Asset Pricing Model (CAPM) – but let’s not dive into the details of that today. For now, let’s just look at the cost of equity number for Medpace Holdings, which is 8.49%. Since Medpace Holdings’s return does not cover its cost, with a difference of -3.70%, this means its current use of equity is not efficient and not sustainable. Very simply, Medpace Holdings pays more for its capital than what it generates in return. ROE can be split up into three useful ratios: net profit margin, asset turnover, and financial leverage. This is called the Dupont Formula:
Dupont Formula
ROE = profit margin × asset turnover × financial leverage
ROE = (annual net profit ÷ sales) × (sales ÷ assets) × (assets ÷ shareholders’ equity)
ROE = annual net profit ÷ shareholders’ equity
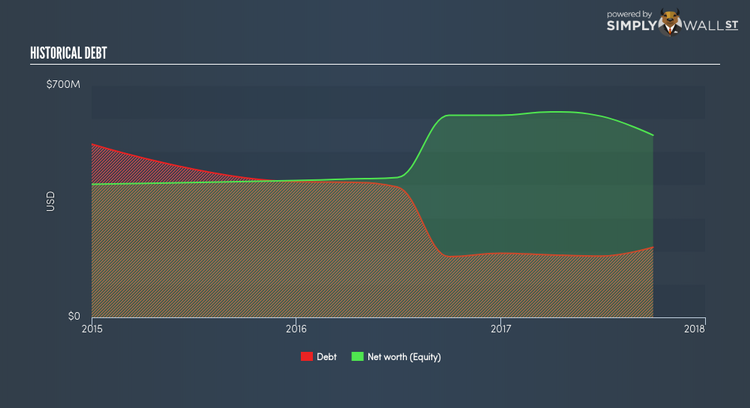
The first component is profit margin, which measures how much of sales is retained after the company pays for all its expenses. Asset turnover reveals how much revenue can be generated from Medpace Holdings’s asset base. The most interesting ratio, and reflective of sustainability of its ROE, is financial leverage. Since financial leverage can artificially inflate ROE, we need to look at how much debt Medpace Holdings currently has. Currently the debt-to-equity ratio stands at a low 38.48%, which means Medpace Holdings still has headroom to take on more leverage in order to increase profits.
What this means for you:
Are you a shareholder? MEDP exhibits a weak ROE against its peers, as well as insufficient levels to cover its own cost of equity this year. Since its existing ROE is not fuelled by unsustainable debt, investors shouldn’t give up as MEDP still has capacity to improve shareholder returns by borrowing to invest in new projects in the future. If you’re looking for new ideas for high-returning stocks, you should take a look at our free platform to see the list of stocks with Return on Equity over 20%.
Are you a potential investor? If you are considering investing in MEDP, looking at ROE on its own is not enough to make a well-informed decision. I recommend you do additional fundamental analysis by looking through our most recent infographic report on Medpace Holdings to help you make a more informed investment decision.
To help readers see pass the short term volatility of the financial market, we aim to bring you a long-term focused research analysis purely driven by fundamental data. Note that our analysis does not factor in the latest price sensitive company announcements.
The author is an independent contributor and at the time of publication had no position in the stocks mentioned.
