Has Metcash Limited (ASX:MTS) Got Enough Cash?

Small-caps and large-caps are wildly popular among investors, however, mid-cap stocks, such as Metcash Limited (ASX:MTS), with a market capitalization of AU$3.10B, rarely draw their attention from the investing community. Despite this, the two other categories have lagged behind the risk-adjusted returns of commonly ignored mid-cap stocks. Let’s take a look at MTS’s debt concentration and assess their financial liquidity to get an idea of their ability to fund strategic acquisitions and grow through cyclical pressures. Note that this commentary is very high-level and solely focused on financial health, so I suggest you dig deeper yourself into MTS here. View our latest analysis for Metcash
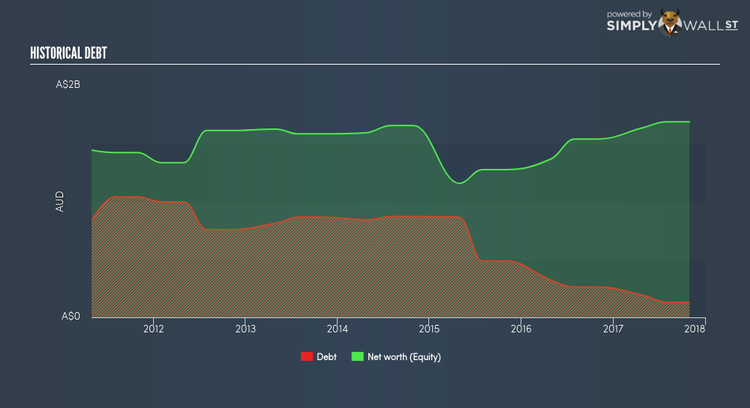
Does MTS generate enough cash through operations?
Over the past year, MTS has reduced its debt from AU$319.70M to AU$190.10M , which is made up of current and long term debt. With this debt payback, MTS’s cash and short-term investments stands at AU$96.50M , ready to deploy into the business. On top of this, MTS has produced AU$304.60M in operating cash flow in the last twelve months, leading to an operating cash to total debt ratio of 160.23%, indicating that MTS’s current level of operating cash is high enough to cover debt. This ratio can also be a sign of operational efficiency as an alternative to return on assets. In MTS’s case, it is able to generate 1.6x cash from its debt capital.
Can MTS meet its short-term obligations with the cash in hand?
At the current liabilities level of AU$1.68B liabilities, the company has maintained a safe level of current assets to meet its obligations, with the current ratio last standing at 1.2x. Usually, for Consumer Retailing companies, this is a suitable ratio since there is a bit of a cash buffer without leaving too much capital in a low-return environment.
Does MTS face the risk of succumbing to its debt-load?
With debt at 7.71% of equity, MTS may be thought of as having low leverage. MTS is not taking on too much debt commitment, which may be constraining for future growth. We can test if MTS’s debt levels are sustainable by measuring interest payments against earnings of a company. Ideally, earnings before interest and tax (EBIT) should cover net interest by at least three times. For MTS, the ratio of 19.99x suggests that interest is comfortably covered, which means that lenders may be less hesitant to lend out more funding as MTS’s high interest coverage is seen as responsible and safe practice.
Next Steps:
MTS’s high cash coverage and low debt levels indicate its ability to utilise its borrowings efficiently in order to generate ample cash flow. Furthermore, the company exhibits an ability to meet its near term obligations should an adverse event occur. Keep in mind I haven’t considered other factors such as how MTS has been performing in the past. I recommend you continue to research Metcash to get a more holistic view of the stock by looking at:
Future Outlook: What are well-informed industry analysts predicting for MTS’s future growth? Take a look at our free research report of analyst consensus for MTS’s outlook.
Valuation: What is MTS worth today? Is the stock undervalued, even when its growth outlook is factored into its intrinsic value? The intrinsic value infographic in our free research report helps visualize whether MTS is currently mispriced by the market.
Other High-Performing Stocks: Are there other stocks that provide better prospects with proven track records? Explore our free list of these great stocks here.
To help readers see pass the short term volatility of the financial market, we aim to bring you a long-term focused research analysis purely driven by fundamental data. Note that our analysis does not factor in the latest price sensitive company announcements.
The author is an independent contributor and at the time of publication had no position in the stocks mentioned.
