Metro Inc.'s (TSE:MRU) largest shareholders are retail investors with 54% ownership, institutions own 46%
Key Insights
The considerable ownership by retail investors in Metro indicates that they collectively have a greater say in management and business strategy
The top 25 shareholders own 41% of the company
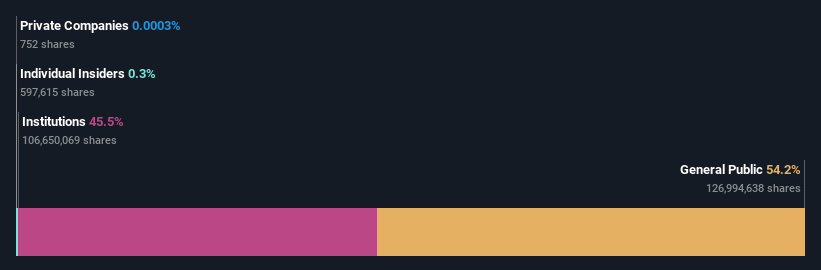
A look at the shareholders of Metro Inc. (TSE:MRU) can tell us which group is most powerful. We can see that retail investors own the lion's share in the company with 54% ownership. In other words, the group stands to gain the most (or lose the most) from their investment into the company.
And institutions on the other hand have a 46% ownership in the company. Generally speaking, as a company grows, institutions will increase their ownership. Conversely, insiders often decrease their ownership over time.
In the chart below, we zoom in on the different ownership groups of Metro.
See our latest analysis for Metro
What Does The Institutional Ownership Tell Us About Metro?
Many institutions measure their performance against an index that approximates the local market. So they usually pay more attention to companies that are included in major indices.
As you can see, institutional investors have a fair amount of stake in Metro. This can indicate that the company has a certain degree of credibility in the investment community. However, it is best to be wary of relying on the supposed validation that comes with institutional investors. They too, get it wrong sometimes. If multiple institutions change their view on a stock at the same time, you could see the share price drop fast. It's therefore worth looking at Metro's earnings history below. Of course, the future is what really matters.

Metro is not owned by hedge funds. The company's largest shareholder is FMR LLC, with ownership of 14%. Meanwhile, the second and third largest shareholders, hold 3.7% and 2.7%, of the shares outstanding, respectively.
A deeper look at our ownership data shows that the top 25 shareholders collectively hold less than half of the register, suggesting a large group of small holders where no single shareholder has a majority.
While it makes sense to study institutional ownership data for a company, it also makes sense to study analyst sentiments to know which way the wind is blowing. There are a reasonable number of analysts covering the stock, so it might be useful to find out their aggregate view on the future.
Insider Ownership Of Metro
The definition of an insider can differ slightly between different countries, but members of the board of directors always count. Management ultimately answers to the board. However, it is not uncommon for managers to be executive board members, especially if they are a founder or the CEO.
I generally consider insider ownership to be a good thing. However, on some occasions it makes it more difficult for other shareholders to hold the board accountable for decisions.
Our information suggests that Metro Inc. insiders own under 1% of the company. It is a very large company, so it would be surprising to see insiders own a large proportion of the company. Though their holding amounts to less than 1%, we can see that board members collectively own CA$42m worth of shares (at current prices). It is good to see board members owning shares, but it might be worth checking if those insiders have been buying.
General Public Ownership
The general public, mostly comprising of individual investors, collectively holds 54% of Metro shares. With this amount of ownership, retail investors can collectively play a role in decisions that affect shareholder returns, such as dividend policies and the appointment of directors. They can also exercise the power to vote on acquisitions or mergers that may not improve profitability.
Next Steps:
I find it very interesting to look at who exactly owns a company. But to truly gain insight, we need to consider other information, too.
Many find it useful to take an in depth look at how a company has performed in the past. You can access this detailed graph of past earnings, revenue and cash flow.
If you would prefer discover what analysts are predicting in terms of future growth, do not miss this free report on analyst forecasts.
NB: Figures in this article are calculated using data from the last twelve months, which refer to the 12-month period ending on the last date of the month the financial statement is dated. This may not be consistent with full year annual report figures.
Have feedback on this article? Concerned about the content? Get in touch with us directly. Alternatively, email editorial-team (at) simplywallst.com.
This article by Simply Wall St is general in nature. We provide commentary based on historical data and analyst forecasts only using an unbiased methodology and our articles are not intended to be financial advice. It does not constitute a recommendation to buy or sell any stock, and does not take account of your objectives, or your financial situation. We aim to bring you long-term focused analysis driven by fundamental data. Note that our analysis may not factor in the latest price-sensitive company announcements or qualitative material. Simply Wall St has no position in any stocks mentioned.
Join A Paid User Research Session
You’ll receive a US$30 Amazon Gift card for 1 hour of your time while helping us build better investing tools for the individual investors like yourself. Sign up here
