Microvision Stock Gains Ground Monday: Technical Levels To Watch

Microvision Inc. (NASDAQ: MVIS) shares traded 3.57% higher Monday, closing at $17.97 with no company news evident to explain the jump.
Here's a look at the stock's technical levels.
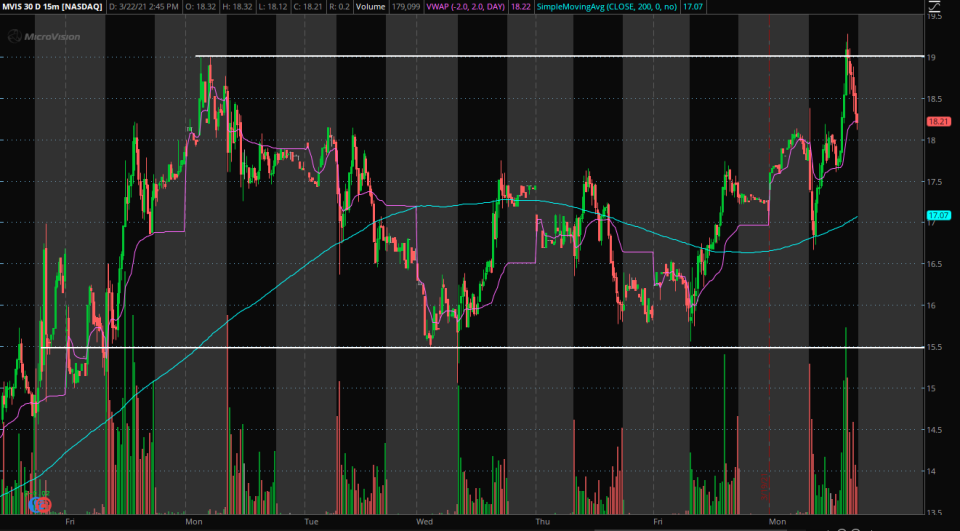
Microvision Short-Term Chart Analysis: The 15-minute chart above shows that Microvision has been trading in a channel between the prices of $15.50 and $19.
The stock has been unable to cross below the $15.50 price level in the short term. This hints that in the future it may hold as a support again.
The chart shows the price has struggled to stay above the $19 level, indicating this is a potential level of resistance in the future.
The stock is trading above both the 200-day moving average (blue) and the volume-weighted average price (pink), indicating the stock has bullish sentiment. These indicators could hold as support in the short term.
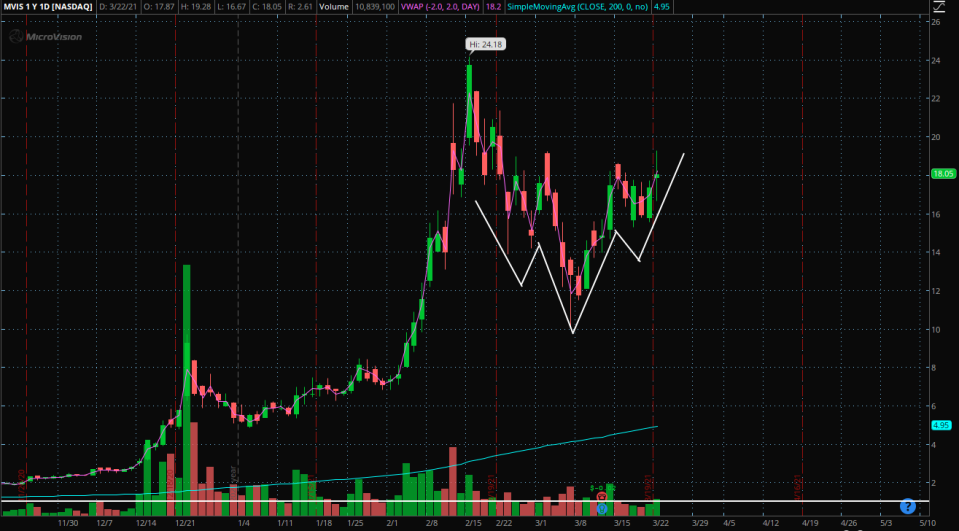
Microvision Daily Chart Analysis: The daily chart above shows the stock looks to be forming what technical traders may call an “inverse head and shoulders” pattern.
The pattern shows there is a support level near the $14 mark. If the price were to cross below this level, the stock may not find support until it reaches near $10.
The resistance of the pattern is shown to be near the $19 level. This is where bulls would like to see a strong close above to confirm the pattern. A strong close above the $20 level may be more ideal for the bulls to confirm the pattern.
Bears would like to see the stock cross below the support level of $14 before falling to the $10 support. If the $10 support were to break, bears may see a strong downward move following.
See more from Benzinga
© 2021 Benzinga.com. Benzinga does not provide investment advice. All rights reserved.
