Can Mixed Fundamentals Have A Negative Impact on REX American Resources Corporation (NYSE:REX) Current Share Price Momentum?
REX American Resources (NYSE:REX) has had a great run on the share market with its stock up by a significant 21% over the last month. But the company's key financial indicators appear to be differing across the board and that makes us question whether or not the company's current share price momentum can be maintained. Specifically, we decided to study REX American Resources' ROE in this article.
Return on equity or ROE is an important factor to be considered by a shareholder because it tells them how effectively their capital is being reinvested. Put another way, it reveals the company's success at turning shareholder investments into profits.
View our latest analysis for REX American Resources
How To Calculate Return On Equity?
The formula for ROE is:
Return on Equity = Net Profit (from continuing operations) ÷ Shareholders' Equity
So, based on the above formula, the ROE for REX American Resources is:
7.3% = US$38m ÷ US$517m (Based on the trailing twelve months to April 2023).
The 'return' is the amount earned after tax over the last twelve months. One way to conceptualize this is that for each $1 of shareholders' capital it has, the company made $0.07 in profit.
Why Is ROE Important For Earnings Growth?
Thus far, we have learned that ROE measures how efficiently a company is generating its profits. Based on how much of its profits the company chooses to reinvest or "retain", we are then able to evaluate a company's future ability to generate profits. Generally speaking, other things being equal, firms with a high return on equity and profit retention, have a higher growth rate than firms that don’t share these attributes.
A Side By Side comparison of REX American Resources' Earnings Growth And 7.3% ROE
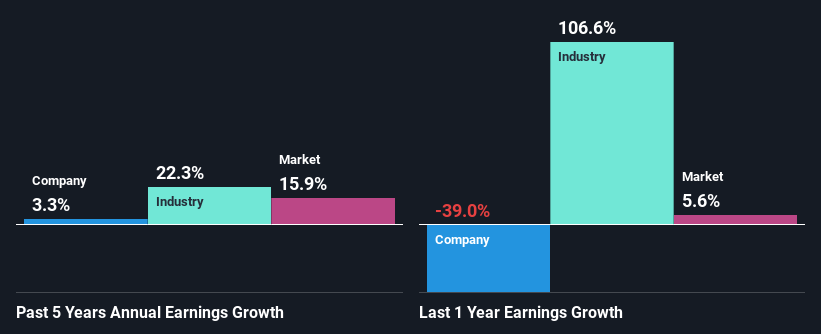
When you first look at it, REX American Resources' ROE doesn't look that attractive. Next, when compared to the average industry ROE of 32%, the company's ROE leaves us feeling even less enthusiastic. Accordingly, REX American Resources' low net income growth of 3.3% over the past five years can possibly be explained by the low ROE amongst other factors.
As a next step, we compared REX American Resources' net income growth with the industry and were disappointed to see that the company's growth is lower than the industry average growth of 22% in the same period.
Earnings growth is an important metric to consider when valuing a stock. It’s important for an investor to know whether the market has priced in the company's expected earnings growth (or decline). Doing so will help them establish if the stock's future looks promising or ominous. If you're wondering about REX American Resources''s valuation, check out this gauge of its price-to-earnings ratio, as compared to its industry.
Is REX American Resources Using Its Retained Earnings Effectively?
REX American Resources doesn't pay any dividend, meaning that potentially all of its profits are being reinvested in the business. This doesn't explain the low earnings growth number that we discussed above. So there might be other factors at play here which could potentially be hampering growth. For example, the business has faced some headwinds.
Summary
On the whole, we feel that the performance shown by REX American Resources can be open to many interpretations. While the company does have a high rate of reinvestment, the low ROE means that all that reinvestment is not reaping any benefit to its investors, and moreover, its having a negative impact on the earnings growth. Having said that, looking at the current analyst estimates, we found that the company's earnings are expected to gain momentum. To know more about the latest analysts predictions for the company, check out this visualization of analyst forecasts for the company.
Have feedback on this article? Concerned about the content? Get in touch with us directly. Alternatively, email editorial-team (at) simplywallst.com.
This article by Simply Wall St is general in nature. We provide commentary based on historical data and analyst forecasts only using an unbiased methodology and our articles are not intended to be financial advice. It does not constitute a recommendation to buy or sell any stock, and does not take account of your objectives, or your financial situation. We aim to bring you long-term focused analysis driven by fundamental data. Note that our analysis may not factor in the latest price-sensitive company announcements or qualitative material. Simply Wall St has no position in any stocks mentioned.
Join A Paid User Research Session
You’ll receive a US$30 Amazon Gift card for 1 hour of your time while helping us build better investing tools for the individual investors like yourself. Sign up here
