Modern Dental Group Limited’s (HKG:3600) Investment Returns Are Lagging Its Industry

Want to participate in a short research study? Help shape the future of investing tools and you could win a $250 gift card!
Today we'll evaluate Modern Dental Group Limited (HKG:3600) to determine whether it could have potential as an investment idea. Specifically, we'll consider its Return On Capital Employed (ROCE), since that will give us an insight into how efficiently the business can generate profits from the capital it requires.
First up, we'll look at what ROCE is and how we calculate it. Then we'll compare its ROCE to similar companies. Last but not least, we'll look at what impact its current liabilities have on its ROCE.
Return On Capital Employed (ROCE): What is it?
ROCE measures the amount of pre-tax profits a company can generate from the capital employed in its business. In general, businesses with a higher ROCE are usually better quality. Ultimately, it is a useful but imperfect metric. Renowned investment researcher Michael Mauboussin has suggested that a high ROCE can indicate that 'one dollar invested in the company generates value of more than one dollar'.
So, How Do We Calculate ROCE?
The formula for calculating the return on capital employed is:
Return on Capital Employed = Earnings Before Interest and Tax (EBIT) ÷ (Total Assets - Current Liabilities)
Or for Modern Dental Group:
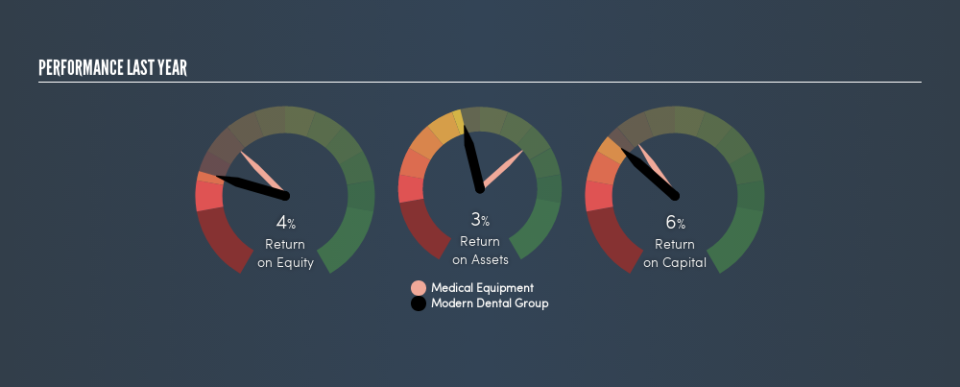
0.062 = HK$173m ÷ (HK$3.1b - HK$305m) (Based on the trailing twelve months to December 2018.)
Therefore, Modern Dental Group has an ROCE of 6.2%.
Check out our latest analysis for Modern Dental Group
Is Modern Dental Group's ROCE Good?
One way to assess ROCE is to compare similar companies. We can see Modern Dental Group's ROCE is meaningfully below the Medical Equipment industry average of 9.8%. This performance is not ideal, as it suggests the company may not be deploying its capital as effectively as some competitors. Aside from the industry comparison, Modern Dental Group's ROCE is mediocre in absolute terms, considering the risk of investing in stocks versus the safety of a bank account. Readers may find more attractive investment prospects elsewhere.
When considering this metric, keep in mind that it is backwards looking, and not necessarily predictive. ROCE can be deceptive for cyclical businesses, as returns can look incredible in boom times, and terribly low in downturns. ROCE is, after all, simply a snap shot of a single year. How cyclical is Modern Dental Group? You can see for yourself by looking at this free graph of past earnings, revenue and cash flow.
What Are Current Liabilities, And How Do They Affect Modern Dental Group's ROCE?
Current liabilities are short term bills and invoices that need to be paid in 12 months or less. The ROCE equation subtracts current liabilities from capital employed, so a company with a lot of current liabilities appears to have less capital employed, and a higher ROCE than otherwise. To check the impact of this, we calculate if a company has high current liabilities relative to its total assets.
Modern Dental Group has total assets of HK$3.1b and current liabilities of HK$305m. As a result, its current liabilities are equal to approximately 9.8% of its total assets. Modern Dental Group reports few current liabilities, which have a negligible impact on its unremarkable ROCE.
The Bottom Line On Modern Dental Group's ROCE
Modern Dental Group looks like an ok business, but on this analysis it is not at the top of our buy list. You might be able to find a better investment than Modern Dental Group. If you want a selection of possible winners, check out this free list of interesting companies that trade on a P/E below 20 (but have proven they can grow earnings).
If you like to buy stocks alongside management, then you might just love this free list of companies. (Hint: insiders have been buying them).
We aim to bring you long-term focused research analysis driven by fundamental data. Note that our analysis may not factor in the latest price-sensitive company announcements or qualitative material.
If you spot an error that warrants correction, please contact the editor at editorial-team@simplywallst.com. This article by Simply Wall St is general in nature. It does not constitute a recommendation to buy or sell any stock, and does not take account of your objectives, or your financial situation. Simply Wall St has no position in the stocks mentioned. Thank you for reading.
