Is There More To Olam International Limited (SGX:O32) Than Its 5.4% Returns On Capital?

Today we’ll look at Olam International Limited (SGX:O32) and reflect on its potential as an investment. Specifically, we’ll consider its Return On Capital Employed (ROCE), since that will give us an insight into how efficiently the business can generate profits from the capital it requires.
First of all, we’ll work out how to calculate ROCE. Then we’ll compare its ROCE to similar companies. Last but not least, we’ll look at what impact its current liabilities have on its ROCE.
Return On Capital Employed (ROCE): What is it?
ROCE is a metric for evaluating how much pre-tax income (in percentage terms) a company earns on the capital invested in its business. Generally speaking a higher ROCE is better. In brief, it is a useful tool, but it is not without drawbacks. Renowned investment researcher Michael Mauboussin has suggested that a high ROCE can indicate that ‘one dollar invested in the company generates value of more than one dollar’.
How Do You Calculate Return On Capital Employed?
The formula for calculating the return on capital employed is:
Return on Capital Employed = Earnings Before Interest and Tax (EBIT) ÷ (Total Assets – Current Liabilities)
Or for Olam International:
0.054 = S$719m ÷ (S$23b – S$10b) (Based on the trailing twelve months to December 2018.)
So, Olam International has an ROCE of 5.4%.
See our latest analysis for Olam International
Is Olam International’s ROCE Good?
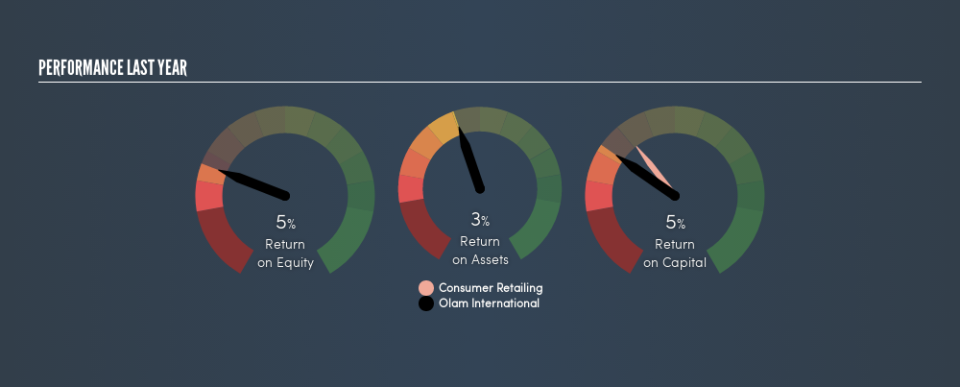
When making comparisons between similar businesses, investors may find ROCE useful. We can see Olam International’s ROCE is around the 6.6% average reported by the Consumer Retailing industry. Aside from the industry comparison, Olam International’s ROCE is mediocre in absolute terms, considering the risk of investing in stocks versus the safety of a bank account. Investors may wish to consider higher-performing investments.
As we can see, Olam International currently has an ROCE of 5.4%, less than the 7.5% it reported 3 years ago. Therefore we wonder if the company is facing new headwinds.
When considering ROCE, bear in mind that it reflects the past and does not necessarily predict the future. Companies in cyclical industries can be difficult to understand using ROCE, as returns typically look high during boom times, and low during busts. This is because ROCE only looks at one year, instead of considering returns across a whole cycle. If Olam International is cyclical, it could make sense to check out this free graph of past earnings, revenue and cash flow.
Do Olam International’s Current Liabilities Skew Its ROCE?
Short term (or current) liabilities, are things like supplier invoices, overdrafts, or tax bills that need to be paid within 12 months. The ROCE equation subtracts current liabilities from capital employed, so a company with a lot of current liabilities appears to have less capital employed, and a higher ROCE than otherwise. To counteract this, we check if a company has high current liabilities, relative to its total assets.
Olam International has total assets of S$23b and current liabilities of S$10b. Therefore its current liabilities are equivalent to approximately 43% of its total assets. Olam International’s middling level of current liabilities have the effect of boosting its ROCE a bit.
Our Take On Olam International’s ROCE
With this level of liabilities and a mediocre ROCE, there are potentially better investments out there. Of course you might be able to find a better stock than Olam International. So you may wish to see this free collection of other companies that have grown earnings strongly.
For those who like to find winning investments this free list of growing companies with recent insider purchasing, could be just the ticket.
We aim to bring you long-term focused research analysis driven by fundamental data. Note that our analysis may not factor in the latest price-sensitive company announcements or qualitative material.
If you spot an error that warrants correction, please contact the editor at editorial-team@simplywallst.com. This article by Simply Wall St is general in nature. It does not constitute a recommendation to buy or sell any stock, and does not take account of your objectives, or your financial situation. Simply Wall St has no position in the stocks mentioned. Thank you for reading.
