Which is More Overbought: US Dollar or S&P 500?
A market will rise until it doesn’t. Both fundamental and technical debate has raged over the months and years about the legitimacy of risk appetite’s rise from the ashes back in 2008/2009. That conversation only grows more intense as record highs for benchmarks like the S&P 500 scale record highs while market yields scrape record lows, growth has proven inconsistent and market participation holds to anemic levels. The external element that fills this wildly divergent gap between price and potential: stimulus.
While the risk-sensitive (stimulus-dependent) capital market’s climb is one fundamental abnormality that is now a common topic of conversation, a relatively newer stimulus-generated disparity has gained far more interest as of last – the positive correlation between risk appetite and the US dollar’s performance. Traditionally, the favored safe haven for the FX world, we expect the greenback to fall while even an ill-deserved risk run is underway.
With the introduction of speculation surrounding Fed ‘tapering’, we have likely lit the fuse for a reversal from one of these two assets. Why? Either the Fed starts to temper its support and risk built on a constant escalation of outside support falls apart will collapse. Otherwise, the dollar’s recent surge to near three-year highs on expectations of an immediate QE3 taper will prove overdone. So, which of these measures of market appetite have over-run their reasonable bounds? (As market conditions change, so should your strategy)
The lynchpin is sentiment itself. If the low-volume, high-reach speculative build up holds steady (it may not even have to post progress); the US dollar will take a spill. Alternatively, if a shock of fear shoots through the market, the greenback will turn from ‘overbought’ to bull trend immediately while the record high S&P 500 will dive over a cliff.
While wait for the fundamental spark to settle this debate, here are measures that show just how overbought the dollar and S&P 500 are.
The US Dollar (Dow Jones FXCM Dollar Index)
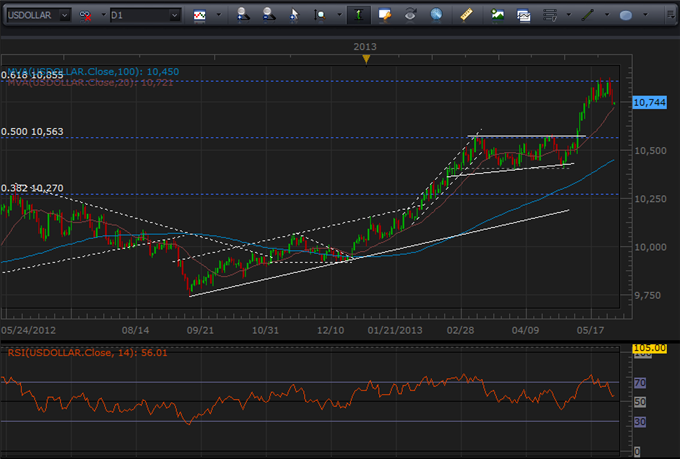
Charting Created by John Kicklighter usingMarketscope 2.0
One of the more recognizable measures of overbought markets is the simple RSI indicator. Above, you see that the standard 14-day RSI has crossed back below 70, so it has crossed down from its ‘extreme’ reading.
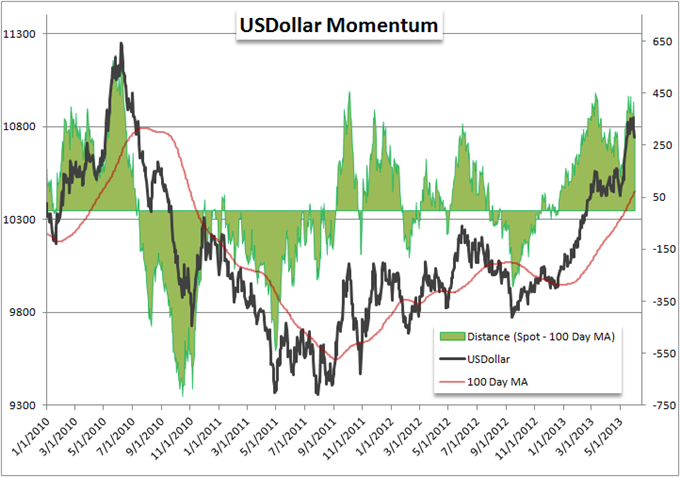
Next we have a different type of read. This uses the 100-day moving average to measure momentum. The green reflects how far above or below USDollar has moved beyond its average. The further it stretches, the greater the potential that the market is overdone. Recently, we have started to pull back from a 450 point spread – the peak back at the beginning of the year and July 2010.
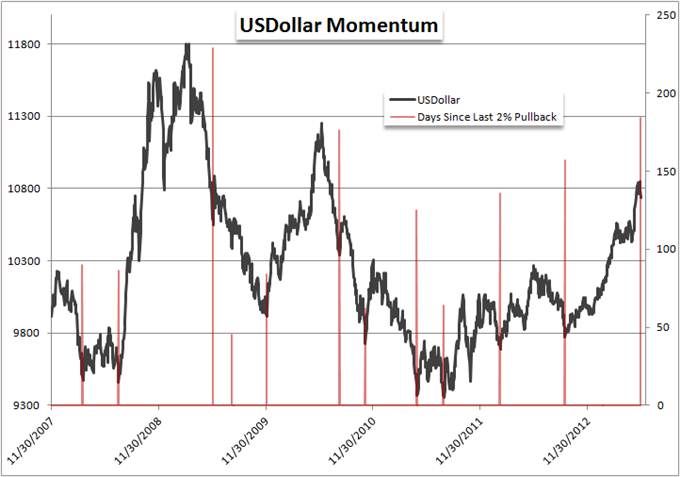
Finally, assuming that markets rise and fall under normal phases as investors enter and exit at various stages in a virtuous cycle, we have are presented with the time period between a reasonable 2 percent decline for the USDollar. As of today, the count is 184 days since the benchmark currency offered such a pullback to draw in fresh bids. That’s the longest period since June 2009.
Risk Trends (The S&P 500)
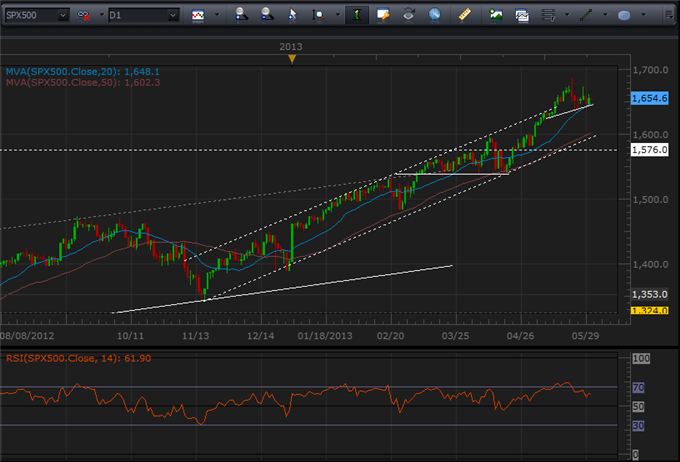
Charting Created by John Kicklighter usingMarketscope 2.0
For the US equity index – the pride and joy of the stimulus effort – the 14-day RSI has once again slipped back below its 70 ‘overbought’ level. This would denote a possible continued selloff opportunity for some, but momentum has not been generous for bears.
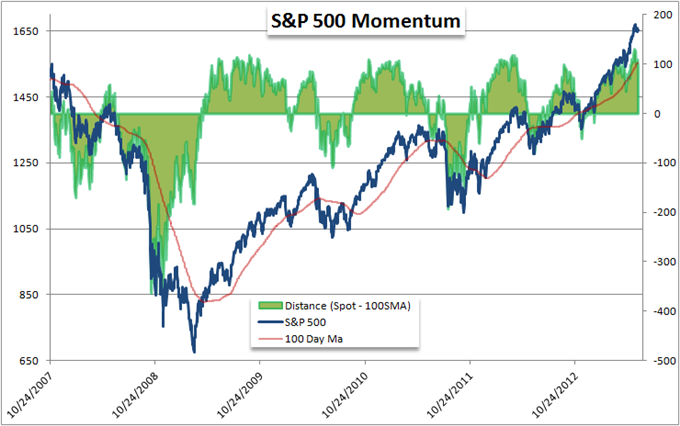
The divergence between the S&P 500’s price and 100-day moving average is even more consistent than the USDollar’s. Momentum on the bull waves have consistently topped out at 120 points before the index’s pace either tempered or it simply corrected. We have hit that level once gain the past month. In fact, the May 17 read of a 130-point spread is the largest on recent record.
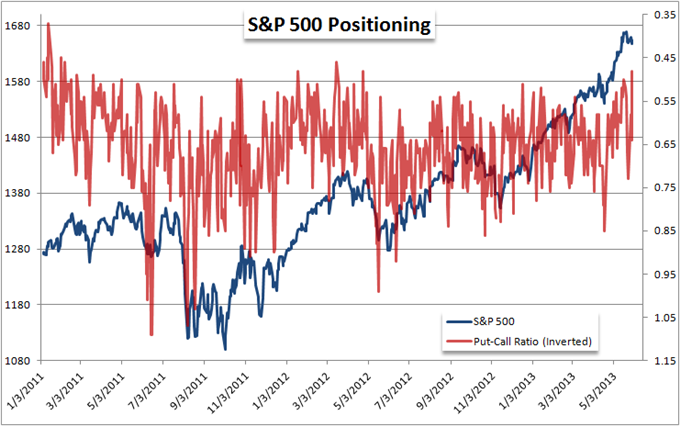
Derivatives can be a useful source of sentiment. Options are often used as a hedging product – especially puts. The above shows the ratio of puts (more frequently insurance) to calls (more often speculative). The balance shows an extreme last seen in April 2012. Extremes in the opposite direction have proven better with establishing reversals (bullish reversals); but the reading is significant in its comparison to 2Q 2012.

Finally, we a day count for the number of days between 10 percent pullbacks for the S&P 500. Well above 400 days (over a year-and-a-half), we are seeing a level of exuberance without rebalancing that rivals the housing boom era that preceded the biggest collapse in markets in generations.
Alone, these indicators are just interesting statistics. Taken together with the abundance of fundamental evidence that speaks to misaligned prices, investors should be weary of how they invest and what they invest in.
--- Written by: John Kicklighter, Chief Strategist for DailyFX.com
Follow me on twitter at http://www.twitter.com/JohnKicklighter
Sign up for John’s email distribution list, here.
DailyFX provides forex news and technical analysis on the trends that influence the global currency markets.
Learn forex trading with a free practice account and trading charts from FXCM.
