What You Must Know About The Cooper Companies, Inc.’s (NYSE:COO) Financial Strength

Want to participate in a short research study? Help shape the future of investing tools and you could win a $250 gift card!
Investors pursuing a solid, dependable stock investment can often be led to The Cooper Companies, Inc. (NYSE:COO), a large-cap worth US$14b. Doing business globally, large caps tend to have diversified revenue streams and attractive capital returns, making them desirable investments for risk-averse portfolios. However, the key to extending previous success is in the health of the company’s financials. I will provide an overview of Cooper Companies’s financial liquidity and leverage to give you an idea of Cooper Companies’s position to take advantage of potential acquisitions or comfortably endure future downturns. Note that this information is centred entirely on financial health and is a high-level overview, so I encourage you to look further into COO here.
View our latest analysis for Cooper Companies
Does COO produce enough cash relative to debt?
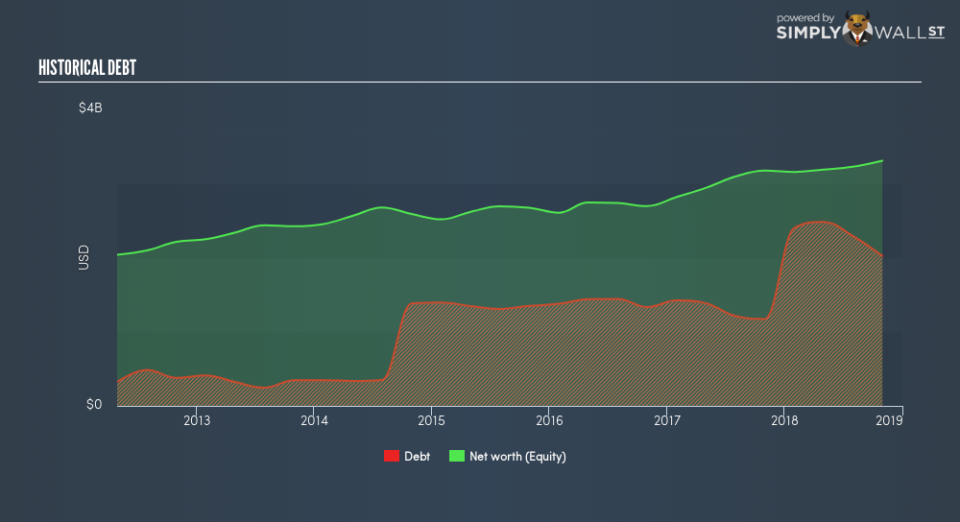
Over the past year, COO has ramped up its debt from US$1.2b to US$2.0b , which accounts for long term debt. With this rise in debt, the current cash and short-term investment levels stands at US$78m , ready to deploy into the business. Additionally, COO has generated US$669m in operating cash flow over the same time period, leading to an operating cash to total debt ratio of 33%, indicating that COO’s debt is appropriately covered by operating cash. This ratio can also be a sign of operational efficiency as an alternative to return on assets. In COO’s case, it is able to generate 0.33x cash from its debt capital.
Can COO pay its short-term liabilities?
At the current liabilities level of US$537m, it appears that the company has been able to meet these obligations given the level of current assets of US$1.1b, with a current ratio of 2.03x. For Medical Equipment companies, this ratio is within a sensible range since there is a bit of a cash buffer without leaving too much capital in a low-return environment.
Does COO face the risk of succumbing to its debt-load?
With a debt-to-equity ratio of 61%, COO can be considered as an above-average leveraged company. This isn’t surprising for large-caps, as equity can often be more expensive to issue than debt, plus interest payments are tax deductible. Consequently, larger-cap organisations tend to enjoy lower cost of capital as a result of easily attained financing, providing an advantage over smaller companies. We can test if COO’s debt levels are sustainable by measuring interest payments against earnings of a company. Ideally, earnings before interest and tax (EBIT) should cover net interest by at least three times. For COO, the ratio of 5.87x suggests that interest is appropriately covered. Large-cap investments like COO are often believed to be a safe investment due to their ability to pump out ample earnings multiple times its interest payments.
Next Steps:
COO’s high cash coverage means that, although its debt levels are high, the company is able to utilise its borrowings efficiently in order to generate cash flow. Since there is also no concerns around COO’s liquidity needs, this may be its optimal capital structure for the time being. This is only a rough assessment of financial health, and I’m sure COO has company-specific issues impacting its capital structure decisions. You should continue to research Cooper Companies to get a better picture of the large-cap by looking at:
Future Outlook: What are well-informed industry analysts predicting for COO’s future growth? Take a look at our free research report of analyst consensus for COO’s outlook.
Valuation: What is COO worth today? Is the stock undervalued, even when its growth outlook is factored into its intrinsic value? The intrinsic value infographic in our free research report helps visualize whether COO is currently mispriced by the market.
Other High-Performing Stocks: Are there other stocks that provide better prospects with proven track records? Explore our free list of these great stocks here.
To help readers see past the short term volatility of the financial market, we aim to bring you a long-term focused research analysis purely driven by fundamental data. Note that our analysis does not factor in the latest price-sensitive company announcements.
The author is an independent contributor and at the time of publication had no position in the stocks mentioned. For errors that warrant correction please contact the editor at editorial-team@simplywallst.com.
