What You Must Know About Finning International Inc.'s (TSE:FTT) Financial Strength

Want to participate in a research study? Help shape the future of investing tools and earn a $60 gift card!
Small and large cap stocks are widely popular for a variety of reasons, however, mid-cap companies such as Finning International Inc. (TSE:FTT), with a market cap of CA$3.7b, often get neglected by retail investors. However, generally ignored mid-caps have historically delivered better risk-adjusted returns than the two other categories of stocks. FTT’s financial liquidity and debt position will be analysed in this article, to get an idea of whether the company can fund opportunities for strategic growth and maintain strength through economic downturns. Remember this is a very top-level look that focuses exclusively on financial health, so I recommend a deeper analysis into FTT here.
Check out our latest analysis for Finning International
Does FTT Produce Much Cash Relative To Its Debt?
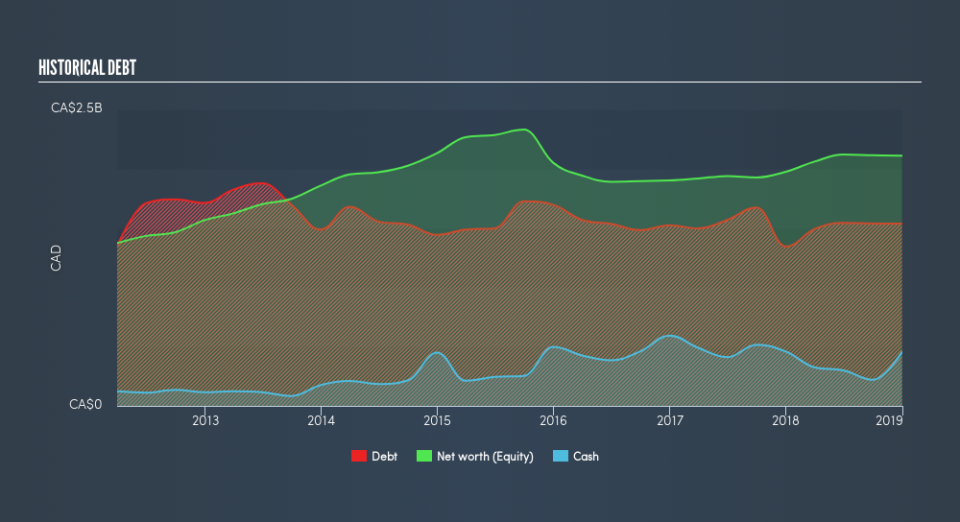
FTT's debt levels surged from CA$1.3b to CA$1.5b over the last 12 months – this includes long-term debt. With this rise in debt, FTT currently has CA$454m remaining in cash and short-term investments , ready to be used for running the business. On top of this, FTT has generated CA$260m in operating cash flow over the same time period, leading to an operating cash to total debt ratio of 17%, meaning that FTT’s current level of operating cash is not high enough to cover debt.
Can FTT pay its short-term liabilities?
With current liabilities at CA$2.0b, the company has been able to meet these obligations given the level of current assets of CA$3.9b, with a current ratio of 1.97x. The current ratio is calculated by dividing current assets by current liabilities. Generally, for Trade Distributors companies, this is a reasonable ratio since there is a bit of a cash buffer without leaving too much capital in a low-return environment.
Can FTT service its debt comfortably?
With debt reaching 73% of equity, FTT may be thought of as relatively highly levered. This is not unusual for mid-caps as debt tends to be a cheaper and faster source of funding for some businesses. We can test if FTT’s debt levels are sustainable by measuring interest payments against earnings of a company. Ideally, earnings before interest and tax (EBIT) should cover net interest by at least three times. For FTT, the ratio of 6.51x suggests that interest is appropriately covered, which means that debtors may be willing to loan the company more money, giving FTT ample headroom to grow its debt facilities.
Next Steps:
Although FTT’s debt level is towards the higher end of the spectrum, its cash flow coverage seems adequate to meet obligations which means its debt is being efficiently utilised. Since there is also no concerns around FTT's liquidity needs, this may be its optimal capital structure for the time being. This is only a rough assessment of financial health, and I'm sure FTT has company-specific issues impacting its capital structure decisions. I suggest you continue to research Finning International to get a more holistic view of the mid-cap by looking at:
Future Outlook: What are well-informed industry analysts predicting for FTT’s future growth? Take a look at our free research report of analyst consensus for FTT’s outlook.
Valuation: What is FTT worth today? Is the stock undervalued, even when its growth outlook is factored into its intrinsic value? The intrinsic value infographic in our free research report helps visualize whether FTT is currently mispriced by the market.
Other High-Performing Stocks: Are there other stocks that provide better prospects with proven track records? Explore our free list of these great stocks here.
We aim to bring you long-term focused research analysis driven by fundamental data. Note that our analysis may not factor in the latest price-sensitive company announcements or qualitative material.
If you spot an error that warrants correction, please contact the editor at editorial-team@simplywallst.com. This article by Simply Wall St is general in nature. It does not constitute a recommendation to buy or sell any stock, and does not take account of your objectives, or your financial situation. Simply Wall St has no position in the stocks mentioned. Thank you for reading.
