What You Must Know About Fortis Inc.’s (TSE:FTS) Financial Strength

Fortis Inc. (TSE:FTS), a large-cap worth CA$19b, comes to mind for investors seeking a strong and reliable stock investment. One reason being its ‘too big to fail’ aura which gives it the appearance of a strong and stable investment. But, the key to their continued success lies in its financial health. I will provide an overview of Fortis’s financial liquidity and leverage to give you an idea of Fortis’s position to take advantage of potential acquisitions or comfortably endure future downturns. Remember this is a very top-level look that focuses exclusively on financial health, so I recommend a deeper analysis into FTS here.
Check out our latest analysis for Fortis
Want to help shape the future of investing tools and platforms? Take the survey and be part of one of the most advanced studies of stock market investors to date.
How much cash does FTS generate through its operations?
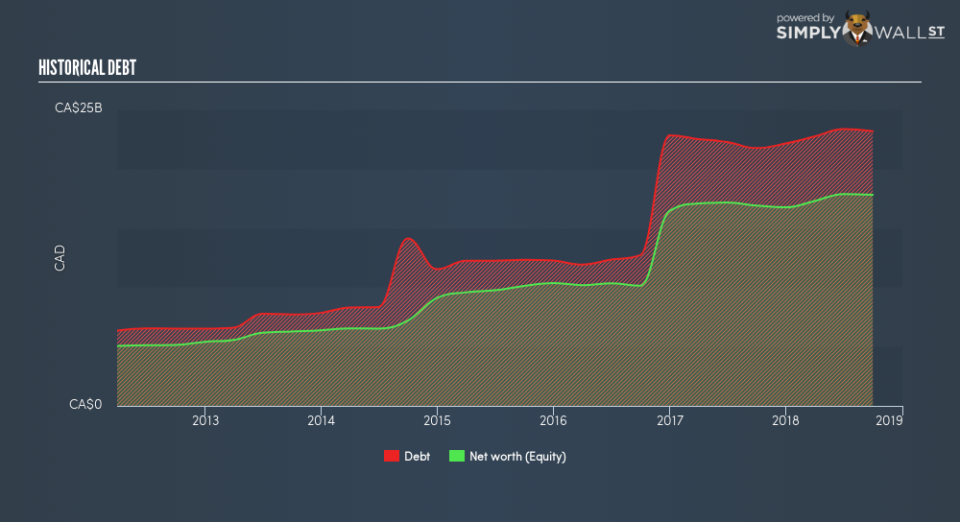
Over the past year, FTS has ramped up its debt from CA$22b to CA$23b , which accounts for long term debt. With this increase in debt, FTS currently has CA$195m remaining in cash and short-term investments for investing into the business. Additionally, FTS has produced cash from operations of CA$2.8b over the same time period, resulting in an operating cash to total debt ratio of 12%, meaning that FTS’s current level of operating cash is not high enough to cover debt. This ratio can also be interpreted as a measure of efficiency as an alternative to return on assets. In FTS’s case, it is able to generate 0.12x cash from its debt capital.
Does FTS’s liquid assets cover its short-term commitments?
Looking at FTS’s CA$3.6b in current liabilities, the company may not be able to easily meet these obligations given the level of current assets of CA$2.1b, with a current ratio of 0.59x.
Can FTS service its debt comfortably?
Considering Fortis’s total debt outweighs its equity, the company is deemed highly levered. This isn’t surprising for large-caps, as equity can often be more expensive to issue than debt, plus interest payments are tax deductible. Accordingly, large companies often have an advantage over small-caps through lower cost of capital due to cheaper financing. We can test if FTS’s debt levels are sustainable by measuring interest payments against earnings of a company. As a rule of thumb, a company should have earnings before interest and tax (EBIT) of at least three times the size of net interest. In FTS’s case, the ratio of 2.42x suggests that interest is not strongly covered. Given the sheer size of Fortis, it’s unlikely to default on interest payments and enter bankruptcy. However, compared to an amply profitable large-cap peer, debtors may see more risk in lending to FTS.
Next Steps:
FTS’s high debt levels is not met with high cash flow coverage. This leaves room for improvement in terms of debt management and operational efficiency. In addition to this, its lack of liquidity raises questions over current asset management practices for the large-cap. This is only a rough assessment of financial health, and I’m sure FTS has company-specific issues impacting its capital structure decisions. I suggest you continue to research Fortis to get a better picture of the stock by looking at:
Future Outlook: What are well-informed industry analysts predicting for FTS’s future growth? Take a look at our free research report of analyst consensus for FTS’s outlook.
Valuation: What is FTS worth today? Is the stock undervalued, even when its growth outlook is factored into its intrinsic value? The intrinsic value infographic in our free research report helps visualize whether FTS is currently mispriced by the market.
Other High-Performing Stocks: Are there other stocks that provide better prospects with proven track records? Explore our free list of these great stocks here.
To help readers see past the short term volatility of the financial market, we aim to bring you a long-term focused research analysis purely driven by fundamental data. Note that our analysis does not factor in the latest price-sensitive company announcements.
The author is an independent contributor and at the time of publication had no position in the stocks mentioned. For errors that warrant correction please contact the editor at editorial-team@simplywallst.com.
