What You Must Know About Helen of Troy Limited’s (NASDAQ:HELE) Financial Health

Small-caps and large-caps are wildly popular among investors; however, mid-cap stocks, such as Helen of Troy Limited (NASDAQ:HELE) with a market-capitalization of US$3.04b, rarely draw their attention. However, history shows that overlooked mid-cap companies have performed better on a risk-adjusted manner than the smaller and larger segment of the market. HELE’s financial liquidity and debt position will be analysed in this article, to get an idea of whether the company can fund opportunities for strategic growth and maintain strength through economic downturns. Don’t forget that this is a general and concentrated examination of Helen of Troy’s financial health, so you should conduct further analysis into HELE here.
View our latest analysis for Helen of Troy
How does HELE’s operating cash flow stack up against its debt?
Over the past year, HELE has reduced its debt from US$453.84m to US$300.12m , which comprises of short- and long-term debt. With this debt payback, the current cash and short-term investment levels stands at US$17.34m for investing into the business. Additionally, HELE has produced US$210.99m in operating cash flow during the same period of time, resulting in an operating cash to total debt ratio of 70.30%, meaning that HELE’s debt is appropriately covered by operating cash. This ratio can also be a sign of operational efficiency as an alternative to return on assets. In HELE’s case, it is able to generate 0.7x cash from its debt capital.
Does HELE’s liquid assets cover its short-term commitments?
At the current liabilities level of US$258.86m liabilities, the company has been able to meet these commitments with a current assets level of US$543.97m, leading to a 2.1x current account ratio. Generally, for Consumer Durables companies, this is a reasonable ratio since there’s sufficient cash cushion without leaving too much capital idle or in low-earning investments.
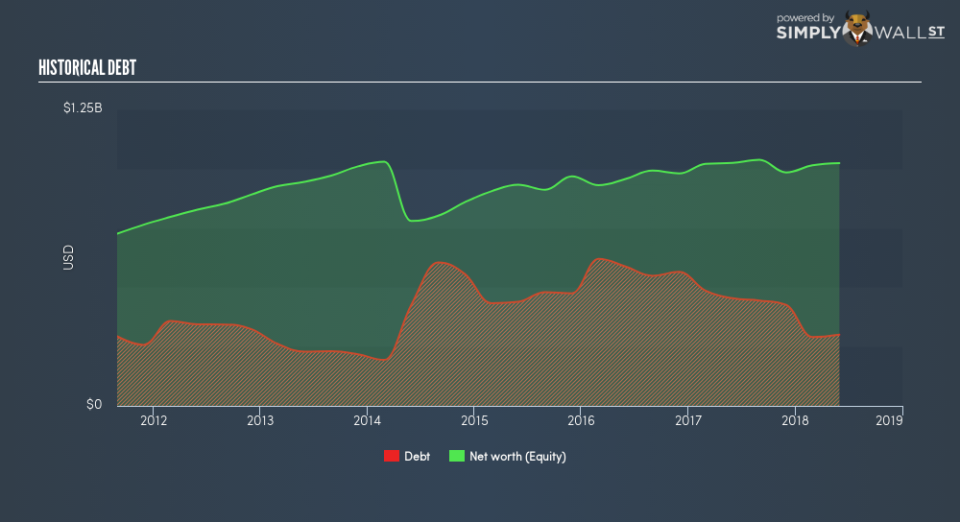
Can HELE service its debt comfortably?
HELE’s level of debt is appropriate relative to its total equity, at 29.32%. This range is considered safe as HELE is not taking on too much debt obligation, which can be restrictive and risky for equity-holders. We can check to see whether HELE is able to meet its debt obligations by looking at the net interest coverage ratio. A company generating earnings before interest and tax (EBIT) at least three times its net interest payments is considered financially sound. In HELE’s, case, the ratio of 15.69x suggests that interest is comfortably covered, which means that lenders may be inclined to lend more money to the company, as it is seen as safe in terms of payback.
Next Steps:
HELE’s high cash coverage and appropriate debt levels indicate its ability to utilise its borrowings efficiently in order to generate ample cash flow. Furthermore, the company exhibits an ability to meet its near term obligations should an adverse event occur. I admit this is a fairly basic analysis for HELE’s financial health. Other important fundamentals need to be considered alongside. I recommend you continue to research Helen of Troy to get a more holistic view of the stock by looking at:
Future Outlook: What are well-informed industry analysts predicting for HELE’s future growth? Take a look at our free research report of analyst consensus for HELE’s outlook.
Valuation: What is HELE worth today? Is the stock undervalued, even when its growth outlook is factored into its intrinsic value? The intrinsic value infographic in our free research report helps visualize whether HELE is currently mispriced by the market.
Other High-Performing Stocks: Are there other stocks that provide better prospects with proven track records? Explore our free list of these great stocks here.
To help readers see past the short term volatility of the financial market, we aim to bring you a long-term focused research analysis purely driven by fundamental data. Note that our analysis does not factor in the latest price-sensitive company announcements.
The author is an independent contributor and at the time of publication had no position in the stocks mentioned. For errors that warrant correction please contact the editor at editorial-team@simplywallst.com.
