What You Must Know About Middlesex Water Company’s (NASDAQ:MSEX) 9.01% ROE

Middlesex Water Company (NASDAQ:MSEX) generated a below-average return on equity of 9.01% in the past 12 months, while its industry returned 12.53%. MSEX’s results could indicate a relatively inefficient operation to its peers, and while this may be the case, it is important to understand what ROE is made up of and how it should be interpreted. Knowing these components could change your view on MSEX’s performance. I will take you through how metrics such as financial leverage impact ROE which may affect the overall sustainability of MSEX’s returns. View our latest analysis for Middlesex Water
Breaking down ROE — the mother of all ratios
Return on Equity (ROE) is a measure of Middlesex Water’s profit relative to its shareholders’ equity. It essentially shows how much the company can generate in earnings given the amount of equity it has raised. In most cases, a higher ROE is preferred; however, there are many other factors we must consider prior to making any investment decisions.
Return on Equity = Net Profit ÷ Shareholders Equity
ROE is assessed against cost of equity, which is measured using the Capital Asset Pricing Model (CAPM) – but let’s not dive into the details of that today. For now, let’s just look at the cost of equity number for Middlesex Water, which is 8.49%. Some of Middlesex Water’s peers may have a higher ROE but its cost of equity could exceed this return, leading to an unsustainable negative discrepancy i.e. the company spends more than it earns. This is not the case for Middlesex Water which is reassuring. ROE can be split up into three useful ratios: net profit margin, asset turnover, and financial leverage. This is called the Dupont Formula:
Dupont Formula
ROE = profit margin × asset turnover × financial leverage
ROE = (annual net profit ÷ sales) × (sales ÷ assets) × (assets ÷ shareholders’ equity)
ROE = annual net profit ÷ shareholders’ equity

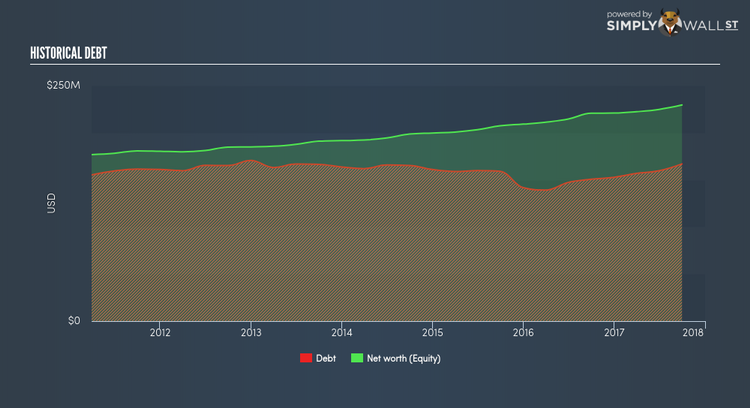
Basically, profit margin measures how much of revenue trickles down into earnings which illustrates how efficient the business is with its cost management. The other component, asset turnover, illustrates how much revenue Middlesex Water can make from its asset base. Finally, financial leverage will be our main focus today. It shows how much of assets are funded by equity and can show how sustainable the company’s capital structure is. Since ROE can be inflated by excessive debt, we need to examine Middlesex Water’s debt-to-equity level. The debt-to-equity ratio currently stands at a sensible 72.72%, meaning the ROE is a result of its capacity to produce profit growth without a huge debt burden.
Next Steps:
While ROE is a relatively simple calculation, it can be broken down into different ratios, each telling a different story about the strengths and weaknesses of a company. Even though Middlesex Water returned below the industry average, its ROE comes in excess of its cost of equity. Its appropriate level of leverage means investors can be more confident in the sustainability of Middlesex Water’s return with a possible increase should the company decide to increase its debt levels. Although ROE can be a useful metric, it is only a small part of diligent research.
For Middlesex Water, I’ve compiled three fundamental aspects you should further examine:
Financial Health: Does it have a healthy balance sheet? Take a look at our free balance sheet analysis with six simple checks on key factors like leverage and risk.
Future Earnings: How does Middlesex Water’s growth rate compare to its peers and the wider market? Dig deeper into the analyst consensus number for the upcoming years by interacting with our free analyst growth expectation chart.
Other High-Growth Alternatives : Are there other high-growth stocks you could be holding instead of Middlesex Water? Explore our interactive list of stocks with large growth potential to get an idea of what else is out there you may be missing!
To help readers see pass the short term volatility of the financial market, we aim to bring you a long-term focused research analysis purely driven by fundamental data. Note that our analysis does not factor in the latest price sensitive company announcements.
The author is an independent contributor and at the time of publication had no position in the stocks mentioned.
