What You Must Know About NewOcean Energy Holdings Limited’s (HKG:342) ROE

I am writing today to help inform people who are new to the stock market and want to begin learning the link between NewOcean Energy Holdings Limited (HKG:342)’s return fundamentals and stock market performance.
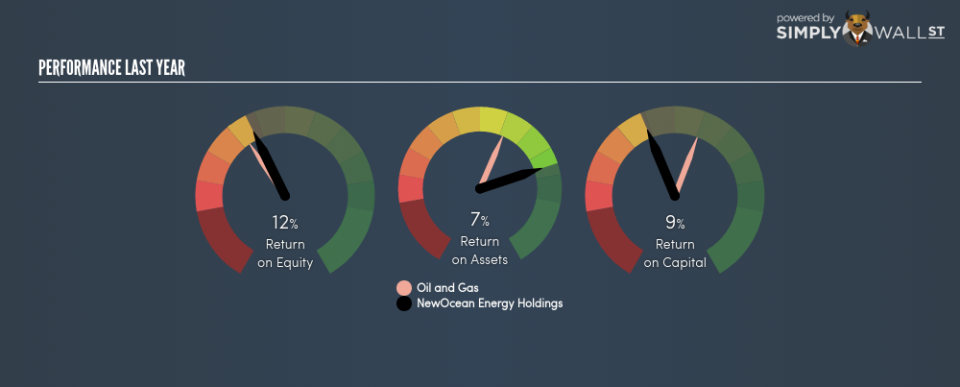
With an ROE of 11.81%, NewOcean Energy Holdings Limited (HKG:342) outpaced its own industry which delivered a less exciting 10.52% over the past year. Superficially, this looks great since we know that 342 has generated big profits with little equity capital; however, ROE doesn’t tell us how much 342 has borrowed in debt. In this article, we’ll closely examine some factors like financial leverage to evaluate the sustainability of 342’s ROE. Check out our latest analysis for NewOcean Energy Holdings
Peeling the layers of ROE – trisecting a company’s profitability
Firstly, Return on Equity, or ROE, is simply the percentage of last years’ earning against the book value of shareholders’ equity. It essentially shows how much the company can generate in earnings given the amount of equity it has raised. In most cases, a higher ROE is preferred; however, there are many other factors we must consider prior to making any investment decisions.
Return on Equity = Net Profit ÷ Shareholders Equity
Returns are usually compared to costs to measure the efficiency of capital. NewOcean Energy Holdings’s cost of equity is 17.80%. This means NewOcean Energy Holdings’s returns actually do not cover its own cost of equity, with a discrepancy of -5.99%. This isn’t sustainable as it implies, very simply, that the company pays more for its capital than what it generates in return. ROE can be split up into three useful ratios: net profit margin, asset turnover, and financial leverage. This is called the Dupont Formula:
Dupont Formula
ROE = profit margin × asset turnover × financial leverage
ROE = (annual net profit ÷ sales) × (sales ÷ assets) × (assets ÷ shareholders’ equity)
ROE = annual net profit ÷ shareholders’ equity
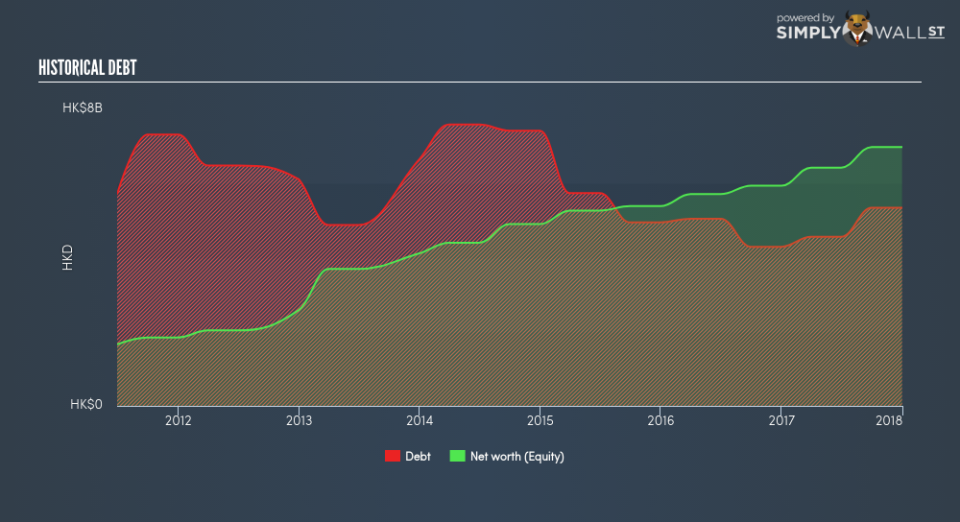
Basically, profit margin measures how much of revenue trickles down into earnings which illustrates how efficient the business is with its cost management. Asset turnover reveals how much revenue can be generated from NewOcean Energy Holdings’s asset base. The most interesting ratio, and reflective of sustainability of its ROE, is financial leverage. Since ROE can be inflated by excessive debt, we need to examine NewOcean Energy Holdings’s debt-to-equity level. Currently the debt-to-equity ratio stands at a reasonable 76.56%, which means its above-average ROE is driven by its ability to grow its profit without a significant debt burden.
Next Steps:
ROE is one of many ratios which meaningfully dissects financial statements, which illustrates the quality of a company. NewOcean Energy Holdings’s above-industry ROE is noteworthy, but it was not high enough to cover its own cost of equity. ROE is not likely to be inflated by excessive debt funding, giving shareholders more conviction in the sustainability of industry-beating returns. Although ROE can be a useful metric, it is only a small part of diligent research.
For NewOcean Energy Holdings, I’ve compiled three pertinent aspects you should further research:
Financial Health: Does it have a healthy balance sheet? Take a look at our free balance sheet analysis with six simple checks on key factors like leverage and risk.
Future Earnings: How does NewOcean Energy Holdings’s growth rate compare to its peers and the wider market? Dig deeper into the analyst consensus number for the upcoming years by interacting with our free analyst growth expectation chart.
Other High-Growth Alternatives : Are there other high-growth stocks you could be holding instead of NewOcean Energy Holdings? Explore our interactive list of stocks with large growth potential to get an idea of what else is out there you may be missing!
To help readers see pass the short term volatility of the financial market, we aim to bring you a long-term focused research analysis purely driven by fundamental data. Note that our analysis does not factor in the latest price sensitive company announcements.
The author is an independent contributor and at the time of publication had no position in the stocks mentioned.
