What You Must Know About Quabit Inmobiliaria SA.’s (BME:QBT) ROE

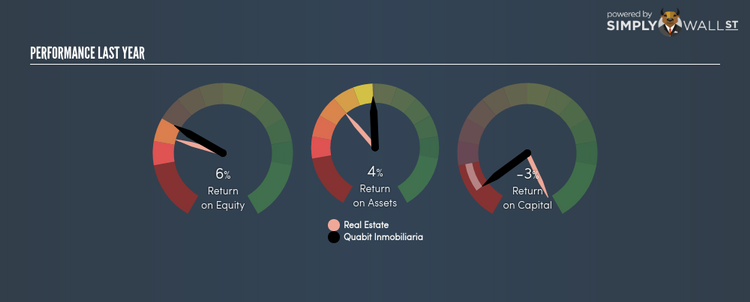
Quabit Inmobiliaria SA. (BME:QBT) outperformed the Diversified Real Estate Activities industry on the basis of its ROE – producing a higher 6.35% relative to the peer average of 4.15% over the past 12 months. While the impressive ratio tells us that QBT has made significant profits from little equity capital, ROE doesn’t tell us if QBT has borrowed debt to make this happen. We’ll take a closer look today at factors like financial leverage to determine whether QBT’s ROE is actually sustainable. See our latest analysis for Quabit Inmobiliaria
Breaking down ROE — the mother of all ratios
Return on Equity (ROE) is a measure of Quabit Inmobiliaria’s profit relative to its shareholders’ equity. It essentially shows how much the company can generate in earnings given the amount of equity it has raised. Generally speaking, a higher ROE is preferred; however, there are other factors we must also consider before making any conclusions.
Return on Equity = Net Profit ÷ Shareholders Equity
ROE is measured against cost of equity in order to determine the efficiency of Quabit Inmobiliaria’s equity capital deployed. Its cost of equity is 18.32%. Given a discrepancy of -11.96% between return and cost, this indicated that Quabit Inmobiliaria may be paying more for its capital than what it’s generating in return. ROE can be broken down into three different ratios: net profit margin, asset turnover, and financial leverage. This is called the Dupont Formula:
Dupont Formula
ROE = profit margin × asset turnover × financial leverage
ROE = (annual net profit ÷ sales) × (sales ÷ assets) × (assets ÷ shareholders’ equity)
ROE = annual net profit ÷ shareholders’ equity
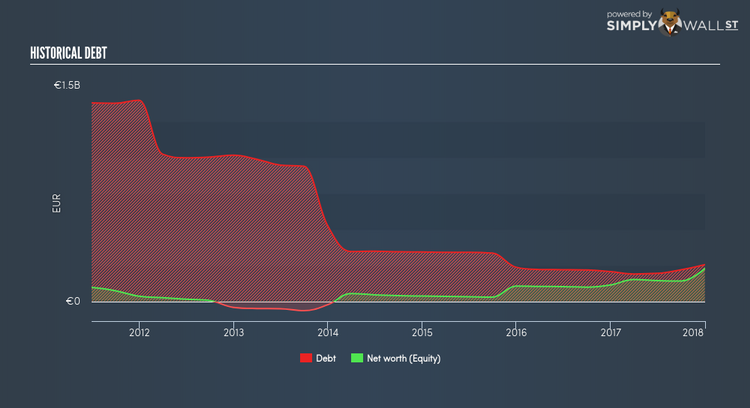
Basically, profit margin measures how much of revenue trickles down into earnings which illustrates how efficient the business is with its cost management. Asset turnover reveals how much revenue can be generated from Quabit Inmobiliaria’s asset base. And finally, financial leverage is simply how much of assets are funded by equity, which exhibits how sustainable the company’s capital structure is. Since ROE can be inflated by excessive debt, we need to examine Quabit Inmobiliaria’s debt-to-equity level. At 112.57%, Quabit Inmobiliaria’s debt-to-equity ratio appears balanced and indicates the above-average ROE is generated from its capacity to increase profit without a large debt burden.
Next Steps:
ROE is one of many ratios which meaningfully dissects financial statements, which illustrates the quality of a company. Quabit Inmobiliaria exhibits a strong ROE against its peers, however it was not high enough to cover its own cost of equity this year. Although ROE can be a useful metric, it is only a small part of diligent research.
For Quabit Inmobiliaria, I’ve put together three key factors you should further research:
Financial Health: Does it have a healthy balance sheet? Take a look at our free balance sheet analysis with six simple checks on key factors like leverage and risk.
Future Earnings: How does Quabit Inmobiliaria’s growth rate compare to its peers and the wider market? Dig deeper into the analyst consensus number for the upcoming years by interacting with our free analyst growth expectation chart.
Other High-Growth Alternatives : Are there other high-growth stocks you could be holding instead of Quabit Inmobiliaria? Explore our interactive list of stocks with large growth potential to get an idea of what else is out there you may be missing!
To help readers see pass the short term volatility of the financial market, we aim to bring you a long-term focused research analysis purely driven by fundamental data. Note that our analysis does not factor in the latest price sensitive company announcements.
The author is an independent contributor and at the time of publication had no position in the stocks mentioned.
