Is MYnd Analytics Inc (NASDAQ:MYND) A Financially Sound Company?

Investors are always looking for growth in small-cap stocks like MYnd Analytics Inc (NASDAQ:MYND), with a market cap of US$12.38m. However, an important fact which most ignore is: how financially healthy is the business? Healthcare Services companies, especially ones that are currently loss-making, tend to be high risk. Assessing first and foremost the financial health is crucial. I believe these basic checks tell most of the story you need to know. Nevertheless, this commentary is still very high-level, so I suggest you dig deeper yourself into MYND here.
How much cash does MYND generate through its operations?
MYND’s debt levels have fallen from US$93.60k to US$36.20k over the last 12 months , which is made up of current and long term debt. With this debt repayment, MYND’s cash and short-term investments stands at US$5.45m for investing into the business. Moving onto cash from operations, its trivial cash flows from operations make the cash-to-debt ratio less useful to us, though these low levels of cash means that operational efficiency is worth a look. As the purpose of this article is a high-level overview, I won’t be looking at this today, but you can examine some of MYND’s operating efficiency ratios such as ROA here.
Can MYND pay its short-term liabilities?
With current liabilities at US$1.55m, the company has maintained a safe level of current assets to meet its obligations, with the current ratio last standing at 3.68x. Though, anything about 3x may be excessive, since MYND may be leaving too much capital in low-earning investments.
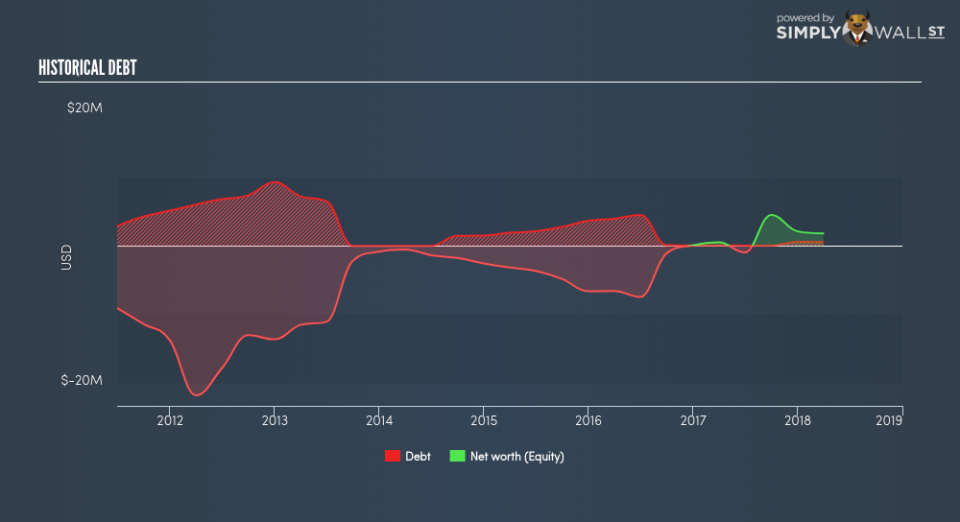
Is MYND’s debt level acceptable?
With a debt-to-equity ratio of 31.43%, MYND’s debt level may be seen as prudent. MYND is not taking on too much debt commitment, which may be constraining for future growth. Risk around debt is very low for MYND, and the company also has the ability and headroom to increase debt if needed going forward.
Next Steps:
MYND’s low debt is also met with low coverage. This indicates room for improvement as its cash flow covers less than a quarter of its borrowings, which means its operating efficiency could be better. However, the company exhibits an ability to meet its near term obligations should an adverse event occur. This is only a rough assessment of financial health, and I’m sure MYND has company-specific issues impacting its capital structure decisions. I suggest you continue to research MYnd Analytics to get a more holistic view of the stock by looking at:
Future Outlook: What are well-informed industry analysts predicting for MYND’s future growth? Take a look at our free research report of analyst consensus for MYND’s outlook.
Historical Performance: What has MYND’s returns been like over the past? Go into more detail in the past track record analysis and take a look at the free visual representations of our analysis for more clarity.
Other High-Performing Stocks: Are there other stocks that provide better prospects with proven track records? Explore our free list of these great stocks here.
To help readers see pass the short term volatility of the financial market, we aim to bring you a long-term focused research analysis purely driven by fundamental data. Note that our analysis does not factor in the latest price sensitive company announcements.
The author is an independent contributor and at the time of publication had no position in the stocks mentioned.
