National Research Corporation (NASDAQ:NRC) Earns A Nice Return On Capital Employed

Today we are going to look at National Research Corporation (NASDAQ:NRC) to see whether it might be an attractive investment prospect. Specifically, we're going to calculate its Return On Capital Employed (ROCE), in the hopes of getting some insight into the business.
Firstly, we'll go over how we calculate ROCE. Second, we'll look at its ROCE compared to similar companies. Last but not least, we'll look at what impact its current liabilities have on its ROCE.
What is Return On Capital Employed (ROCE)?
ROCE measures the 'return' (pre-tax profit) a company generates from capital employed in its business. Generally speaking a higher ROCE is better. Overall, it is a valuable metric that has its flaws. Renowned investment researcher Michael Mauboussin has suggested that a high ROCE can indicate that 'one dollar invested in the company generates value of more than one dollar'.
So, How Do We Calculate ROCE?
Analysts use this formula to calculate return on capital employed:
Return on Capital Employed = Earnings Before Interest and Tax (EBIT) ÷ (Total Assets - Current Liabilities)
Or for National Research:
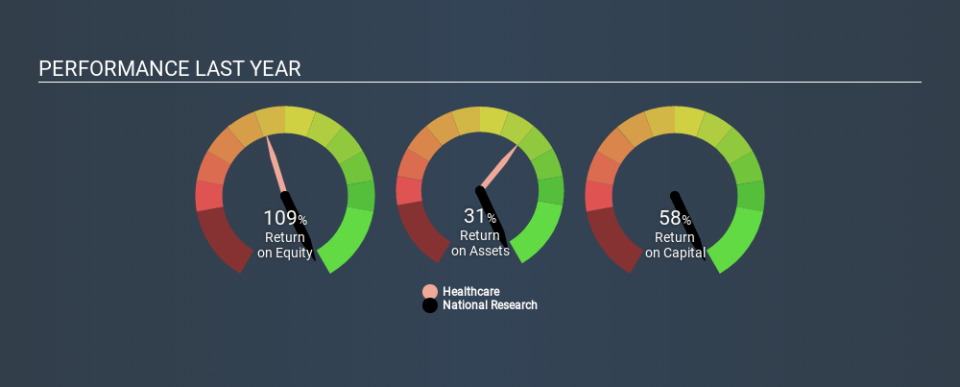
0.58 = US$41m ÷ (US$108m - US$38m) (Based on the trailing twelve months to September 2019.)
Therefore, National Research has an ROCE of 58%.
Check out our latest analysis for National Research
Is National Research's ROCE Good?
ROCE is commonly used for comparing the performance of similar businesses. In our analysis, National Research's ROCE is meaningfully higher than the 11% average in the Healthcare industry. We consider this a positive sign, because it suggests it uses capital more efficiently than similar companies. Putting aside its position relative to its industry for now, in absolute terms, National Research's ROCE is currently very good.
We can see that, National Research currently has an ROCE of 58% compared to its ROCE 3 years ago, which was 34%. This makes us think about whether the company has been reinvesting shrewdly. You can see in the image below how National Research's ROCE compares to its industry. Click to see more on past growth.
Remember that this metric is backwards looking - it shows what has happened in the past, and does not accurately predict the future. ROCE can be deceptive for cyclical businesses, as returns can look incredible in boom times, and terribly low in downturns. This is because ROCE only looks at one year, instead of considering returns across a whole cycle. You can check if National Research has cyclical profits by looking at this free graph of past earnings, revenue and cash flow.
Do National Research's Current Liabilities Skew Its ROCE?
Current liabilities include invoices, such as supplier payments, short-term debt, or a tax bill, that need to be paid within 12 months. The ROCE equation subtracts current liabilities from capital employed, so a company with a lot of current liabilities appears to have less capital employed, and a higher ROCE than otherwise. To counteract this, we check if a company has high current liabilities, relative to its total assets.
National Research has total assets of US$108m and current liabilities of US$38m. As a result, its current liabilities are equal to approximately 36% of its total assets. National Research's ROCE is boosted somewhat by its middling amount of current liabilities.
The Bottom Line On National Research's ROCE
Even so, it has a great ROCE, and could be an attractive prospect for further research. There might be better investments than National Research out there, but you will have to work hard to find them . These promising businesses with rapidly growing earnings might be right up your alley.
If you like to buy stocks alongside management, then you might just love this free list of companies. (Hint: insiders have been buying them).
If you spot an error that warrants correction, please contact the editor at editorial-team@simplywallst.com. This article by Simply Wall St is general in nature. It does not constitute a recommendation to buy or sell any stock, and does not take account of your objectives, or your financial situation. Simply Wall St has no position in the stocks mentioned.
We aim to bring you long-term focused research analysis driven by fundamental data. Note that our analysis may not factor in the latest price-sensitive company announcements or qualitative material. Thank you for reading.
